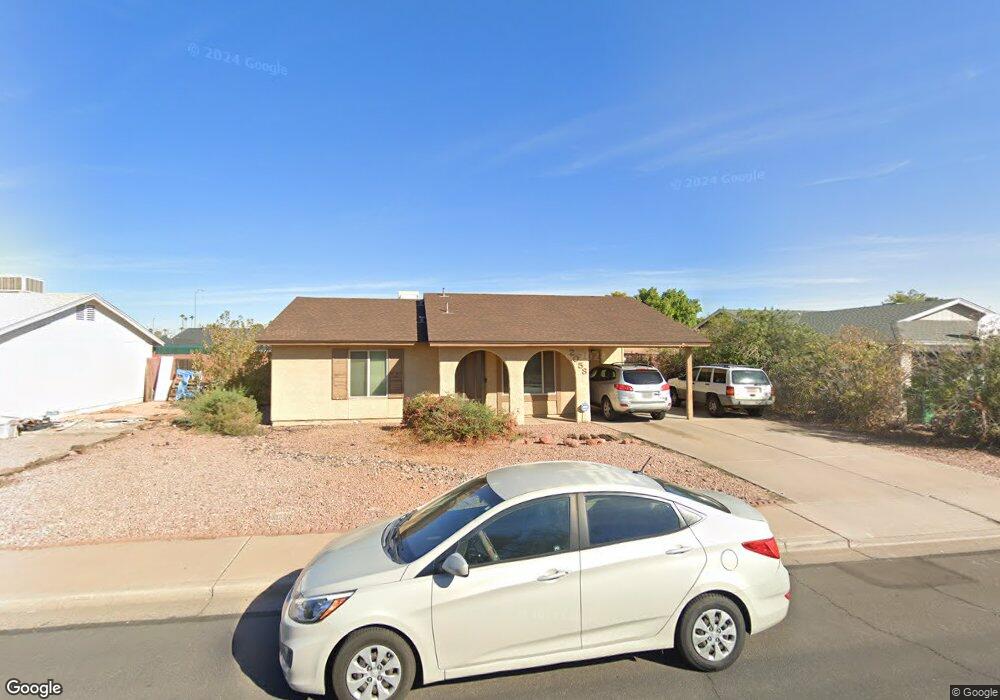
2058 W Posada Ave Mesa, AZ 85202
Dobson NeighborhoodEstimated Value: $345,916 - $444,000
Studio
2
Baths
1,340
Sq Ft
$298/Sq Ft
Est. Value
About This Home
This home is located at 2058 W Posada Ave, Mesa, AZ 85202 and is currently estimated at $399,729, approximately $298 per square foot. 2058 W Posada Ave is a home located in Maricopa County with nearby schools including Franklin at Brimhall Elementary School, Franklin Accelerated Academy Jordan Campus, and Washington Elementary School.
Ownership History
Date
Name
Owned For
Owner Type
Purchase Details
Closed on
Jun 5, 2009
Sold by
Spiak Dawn S
Bought by
The Dawn S Spiak Living Trust and Spiak Dawn S
Current Estimated Value
Purchase Details
Closed on
Jun 16, 1998
Sold by
Phelps Tricia
Bought by
Long Mark Wayne and Long Mark W
Home Financials for this Owner
Home Financials are based on the most recent Mortgage that was taken out on this home.
Original Mortgage
$97,000
Outstanding Balance
$19,152
Interest Rate
6.9%
Mortgage Type
New Conventional
Estimated Equity
$380,577
Purchase Details
Closed on
Nov 14, 1995
Sold by
Kapfer Mark A and Kapfer Debbi D
Bought by
Phelps Tricia
Home Financials for this Owner
Home Financials are based on the most recent Mortgage that was taken out on this home.
Original Mortgage
$84,356
Interest Rate
7.42%
Mortgage Type
FHA
Create a Home Valuation Report for This Property
The Home Valuation Report is an in-depth analysis detailing your home's value as well as a comparison with similar homes in the area
Home Values in the Area
Average Home Value in this Area
Purchase History
| Date | Buyer | Sale Price | Title Company |
|---|---|---|---|
| The Dawn S Spiak Living Trust | -- | None Available | |
| Long Mark Wayne | $97,000 | Equity Title Agency | |
| Phelps Tricia | $85,000 | United Title Agency |
Source: Public Records
Mortgage History
| Date | Status | Borrower | Loan Amount |
|---|---|---|---|
| Open | Long Mark Wayne | $97,000 | |
| Previous Owner | Phelps Tricia | $84,356 |
Source: Public Records
Tax History
| Year | Tax Paid | Tax Assessment Tax Assessment Total Assessment is a certain percentage of the fair market value that is determined by local assessors to be the total taxable value of land and additions on the property. | Land | Improvement |
|---|---|---|---|---|
| 2025 | $1,080 | $13,001 | -- | -- |
| 2024 | $1,091 | $12,382 | -- | -- |
| 2023 | $1,091 | $31,430 | $6,280 | $25,150 |
| 2022 | $1,068 | $23,270 | $4,650 | $18,620 |
| 2021 | $1,097 | $21,480 | $4,290 | $17,190 |
| 2020 | $1,082 | $18,010 | $3,600 | $14,410 |
| 2019 | $1,002 | $16,520 | $3,300 | $13,220 |
| 2018 | $957 | $14,020 | $2,800 | $11,220 |
| 2017 | $927 | $12,560 | $2,510 | $10,050 |
| 2016 | $910 | $11,620 | $2,320 | $9,300 |
| 2015 | $859 | $10,720 | $2,140 | $8,580 |
Source: Public Records
Map
Nearby Homes
- 3124 S Los Altos
- 2263 W Peralta Ave
- 2064 W Obispo Ave
- 3306 N Morino St
- 2006 W Summit Place
- 1853 W Plata Ave
- 2215 W Straford Dr
- 2937 S Pennington
- 2431 W Portobello Ave
- 2031 W Nopal Ave
- 3109 N Pennington Dr
- 1821 W Naranja Ave
- 1800 W Elliot Rd Unit 237
- 1800 W Elliot Rd Unit 227
- 2719 S Santa Barbara
- 1859 W Navarro Ave
- 2113 W Bentrup St
- 1643 W Naranja Ave
- 1549 W Peralta Ave
- 2951 N Carriage Ln
- 2064 W Posada Ave
- 2050 W Posada Ave
- 2057 W Pampa Ave
- 2063 W Posada Ave
- 2049 W Pampa Ave
- 2106 W Posada Ave
- 2059 W Posada Ave
- 2065 W Posada Ave
- 2051 W Posada Ave
- 2051 W Posada Ave
- 2107 W Pampa Ave
- 2038 W Posada Cir
- 2105 W Posada Ave
- 2116 W Posada Ave
- 2041 W Pampa Cir
- 2113 W Pampa Ave
- 2039 W Posada Cir
- 2060 W Peralta Ave
- 2062 W Pampa Ave
Your Personal Tour Guide
Ask me questions while you tour the home.