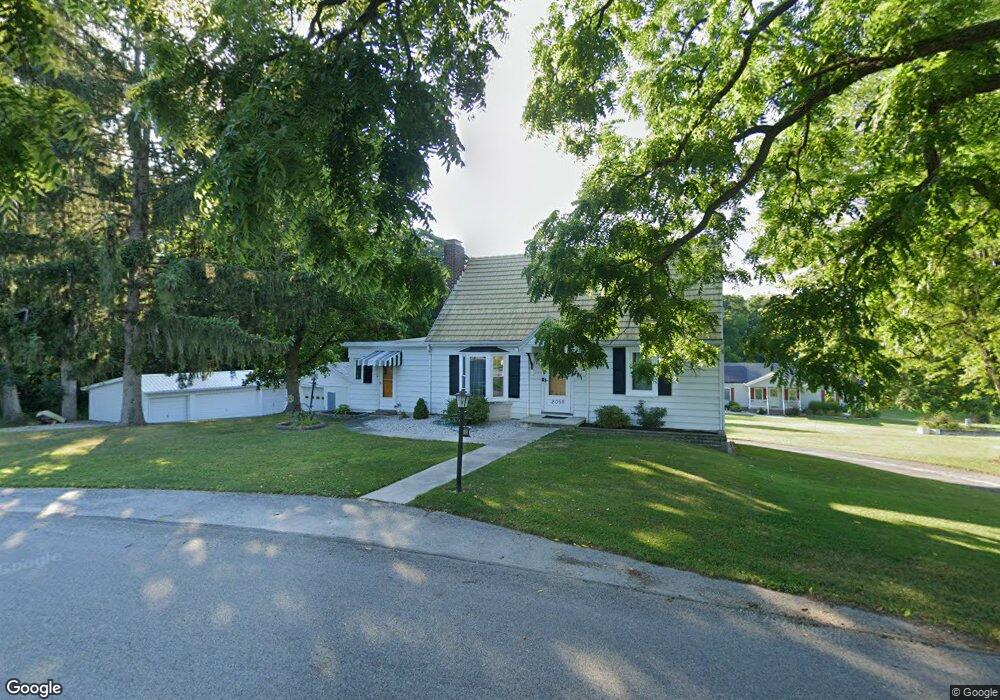
2058 Yingling Dr Spring Grove, PA 17362
Estimated Value: $179,000 - $287,000
4
Beds
1
Bath
1,471
Sq Ft
$164/Sq Ft
Est. Value
About This Home
This home is located at 2058 Yingling Dr, Spring Grove, PA 17362 and is currently estimated at $240,985, approximately $163 per square foot. 2058 Yingling Dr is a home located in York County with nearby schools including Spring Grove Area Middle School, Spring Grove Area High School, and Hope Christian School Of Hanover.
Ownership History
Date
Name
Owned For
Owner Type
Purchase Details
Closed on
Aug 4, 2023
Sold by
Turtle Creek Investments Llc
Bought by
Mcmurphy Lindsay R and Mcmurphy Daniel
Current Estimated Value
Purchase Details
Closed on
Aug 5, 2010
Sold by
Adamark Investments Llc
Bought by
Turtle Creek Investments Llc
Home Financials for this Owner
Home Financials are based on the most recent Mortgage that was taken out on this home.
Original Mortgage
$120,000
Interest Rate
4.73%
Mortgage Type
Future Advance Clause Open End Mortgage
Purchase Details
Closed on
Apr 16, 2010
Sold by
Bailey Treva R
Bought by
Adamark Investments Llc
Home Financials for this Owner
Home Financials are based on the most recent Mortgage that was taken out on this home.
Original Mortgage
$78,790
Interest Rate
5%
Mortgage Type
Seller Take Back
Purchase Details
Closed on
Apr 13, 2010
Sold by
Accardi Phyllis R and Wenger Kenneth E
Bought by
Bailey Treva R
Home Financials for this Owner
Home Financials are based on the most recent Mortgage that was taken out on this home.
Original Mortgage
$78,790
Interest Rate
5%
Mortgage Type
Seller Take Back
Create a Home Valuation Report for This Property
The Home Valuation Report is an in-depth analysis detailing your home's value as well as a comparison with similar homes in the area
Home Values in the Area
Average Home Value in this Area
Purchase History
| Date | Buyer | Sale Price | Title Company |
|---|---|---|---|
| Mcmurphy Lindsay R | $160,000 | None Listed On Document | |
| Turtle Creek Investments Llc | $120,000 | None Available | |
| Adamark Investments Llc | $83,790 | None Available | |
| Bailey Treva R | -- | None Available | |
| Bailey Treva R | -- | None Available |
Source: Public Records
Mortgage History
| Date | Status | Borrower | Loan Amount |
|---|---|---|---|
| Previous Owner | Turtle Creek Investments Llc | $120,000 | |
| Previous Owner | Adamark Investments Llc | $78,790 |
Source: Public Records
Tax History Compared to Growth
Tax History
| Year | Tax Paid | Tax Assessment Tax Assessment Total Assessment is a certain percentage of the fair market value that is determined by local assessors to be the total taxable value of land and additions on the property. | Land | Improvement |
|---|---|---|---|---|
| 2025 | $4,440 | $132,130 | $43,370 | $88,760 |
| 2024 | $4,392 | $132,130 | $43,370 | $88,760 |
| 2023 | $4,392 | $132,130 | $43,370 | $88,760 |
| 2022 | $4,392 | $132,130 | $43,370 | $88,760 |
| 2021 | $4,204 | $132,130 | $43,370 | $88,760 |
| 2020 | $4,204 | $132,130 | $43,370 | $88,760 |
| 2019 | $4,114 | $132,130 | $43,370 | $88,760 |
| 2018 | $4,060 | $132,130 | $43,370 | $88,760 |
| 2017 | $3,934 | $132,130 | $43,370 | $88,760 |
| 2016 | -- | $132,130 | $43,370 | $88,760 |
| 2015 | $2,780 | $132,130 | $43,370 | $88,760 |
| 2014 | $2,780 | $132,130 | $43,370 | $88,760 |
Source: Public Records
Map
Nearby Homes
- 1844 Liberty Rd
- 1621 Spring St
- 1342 Marburg Rd
- 1098 Porters Rd
- 1063 Porters Rd
- 1120 Hoff Rd
- 125 Northview Dr
- 6 Amanda Ave
- 758 Bankert Rd
- 6170 York Rd
- 1315 Moulstown Rd N
- 1010 Marietta Ave
- 366 Jasmine Dr
- 345 Jasmine Dr
- 1233 Glatco Lodge Rd
- 113 Timber Ln
- 2287 Grandview Rd
- 265 Breezewood Dr
- 37 Magnolia Ln
- 5931 York Rd
- 2062 Yingling Dr
- 2050 Yingling Dr
- 2060 Yingling Dr
- 2074 Yingling Dr
- 2094 Yingling Dr
- 2040 Yingling Dr
- 2075 Yingling Dr
- 2024 Yingling Dr
- 2098 Yingling Dr
- 2032 Yingling Dr
- 2030 Yingling Dr
- 2016 Yingling Dr
- 2034 Yingling Dr
- 2008 Yingling Dr
- 2100 Yingling Dr
- 2000 Yingling Dr
- 6465 Thoman Dr
- 2115 Yingling Dr
- 1996 Yingling Dr
- 2124 Yingling Dr