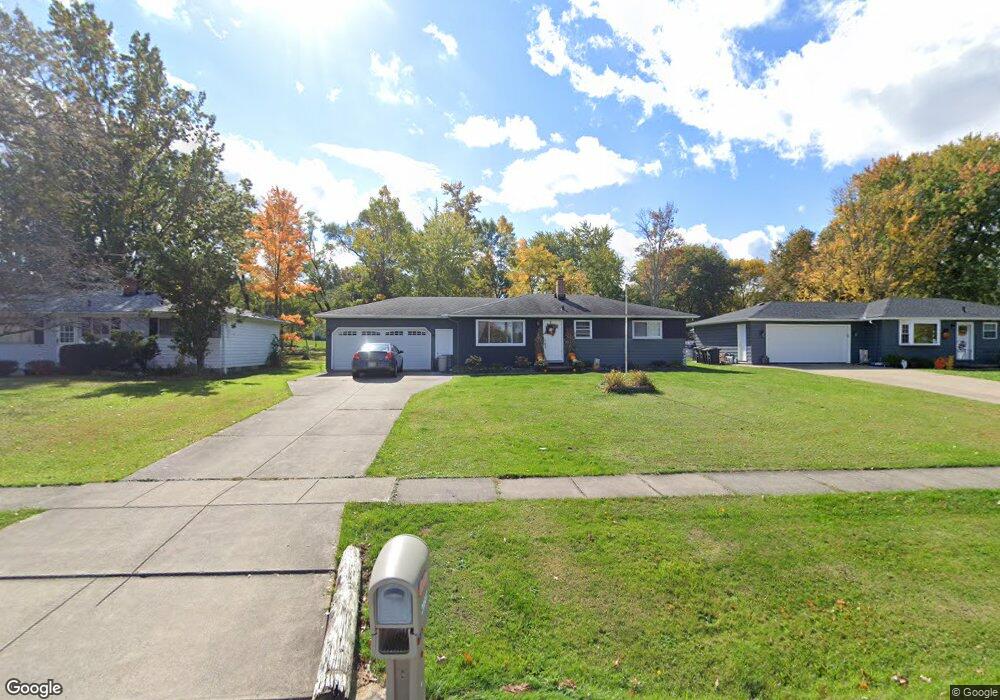
20587 Westwood Park Blvd Strongsville, OH 44149
Estimated Value: $210,000 - $255,000
3
Beds
1
Bath
988
Sq Ft
$237/Sq Ft
Est. Value
About This Home
This home is located at 20587 Westwood Park Blvd, Strongsville, OH 44149 and is currently estimated at $234,045, approximately $236 per square foot. 20587 Westwood Park Blvd is a home located in Cuyahoga County with nearby schools including Strongsville High School, Strongsville Academy, and Sts Joseph & John Interparochial School.
Ownership History
Date
Name
Owned For
Owner Type
Purchase Details
Closed on
Jun 1, 2020
Sold by
Mcbean Brian and Mcbean Lisa M
Bought by
Crotts Zachary and Reagan Annie
Current Estimated Value
Home Financials for this Owner
Home Financials are based on the most recent Mortgage that was taken out on this home.
Original Mortgage
$144,337
Outstanding Balance
$128,182
Interest Rate
3.3%
Mortgage Type
FHA
Estimated Equity
$105,863
Purchase Details
Closed on
Nov 21, 1997
Sold by
Bernard George C
Bought by
Mcbean Brian and Mcbean Lisa M
Home Financials for this Owner
Home Financials are based on the most recent Mortgage that was taken out on this home.
Original Mortgage
$98,750
Interest Rate
7.38%
Mortgage Type
New Conventional
Purchase Details
Closed on
Mar 15, 1985
Sold by
Bernard George C and Bernard Lillian
Bought by
Bernard George C
Purchase Details
Closed on
Jan 1, 1975
Bought by
Bernard George C and Bernard Lillian
Create a Home Valuation Report for This Property
The Home Valuation Report is an in-depth analysis detailing your home's value as well as a comparison with similar homes in the area
Home Values in the Area
Average Home Value in this Area
Purchase History
| Date | Buyer | Sale Price | Title Company |
|---|---|---|---|
| Crotts Zachary | $147,000 | Newman Title | |
| Mcbean Brian | $83,000 | -- | |
| Bernard George C | -- | -- | |
| Bernard George C | -- | -- |
Source: Public Records
Mortgage History
| Date | Status | Borrower | Loan Amount |
|---|---|---|---|
| Open | Crotts Zachary | $144,337 | |
| Previous Owner | Mcbean Brian | $98,750 |
Source: Public Records
Tax History Compared to Growth
Tax History
| Year | Tax Paid | Tax Assessment Tax Assessment Total Assessment is a certain percentage of the fair market value that is determined by local assessors to be the total taxable value of land and additions on the property. | Land | Improvement |
|---|---|---|---|---|
| 2024 | $3,124 | $66,535 | $13,055 | $53,480 |
| 2023 | $3,491 | $55,760 | $13,580 | $42,180 |
| 2022 | $3,466 | $55,755 | $13,580 | $42,175 |
| 2021 | $3,439 | $55,760 | $13,580 | $42,180 |
| 2020 | $3,186 | $45,710 | $11,130 | $34,580 |
| 2019 | $3,093 | $130,600 | $31,800 | $98,800 |
| 2018 | $2,807 | $45,710 | $11,130 | $34,580 |
| 2017 | $2,780 | $41,900 | $9,520 | $32,380 |
| 2016 | $2,757 | $41,900 | $9,520 | $32,380 |
| 2015 | $2,714 | $41,900 | $9,520 | $32,380 |
| 2014 | $2,714 | $40,670 | $9,240 | $31,430 |
Source: Public Records
Map
Nearby Homes
- 13236 Tomson Dr
- 12651 Alameda Dr
- 14400 Prospect Rd
- 20078 Trapper Trail
- 12694 Ionia Ct
- 12647 Edgepark Cir
- 22125 Olde Creek Trail
- 14896 Britannia Ct
- 19620 Porters Ln Unit 15F
- 14112 Settlers Way
- 15017 Regency Dr
- 14890 Prospect Rd
- 13156 Olympus Way
- 13066 Olympus Way
- 12385 Corinth Ct
- 13099 Olympus Way
- 22235 North Trail
- 12539 Olympus Way
- 15001 Scarlet Oak Trail
- 20678 Spruce Dr
- 20559 Westwood Park Blvd
- 20529 Westwood Park Blvd
- 20625 Westwood Park Blvd
- 20560 Collier Dr
- 20530 Collier Dr
- 20499 Westwood Park Blvd
- 20588 Collier Dr
- 13548 Richards Dr
- 13549 Richards Dr
- 20500 Collier Dr
- 20618 Collier Dr
- 13599 Atlantic Rd
- 13643 Atlantic Rd
- 13557 Atlantic Rd
- 13687 Atlantic Rd
- 13504 Richards Dr
- 20472 Collier Dr
- 13505 Richards Dr
- 13729 Atlantic Rd
- 13548 Yager Dr