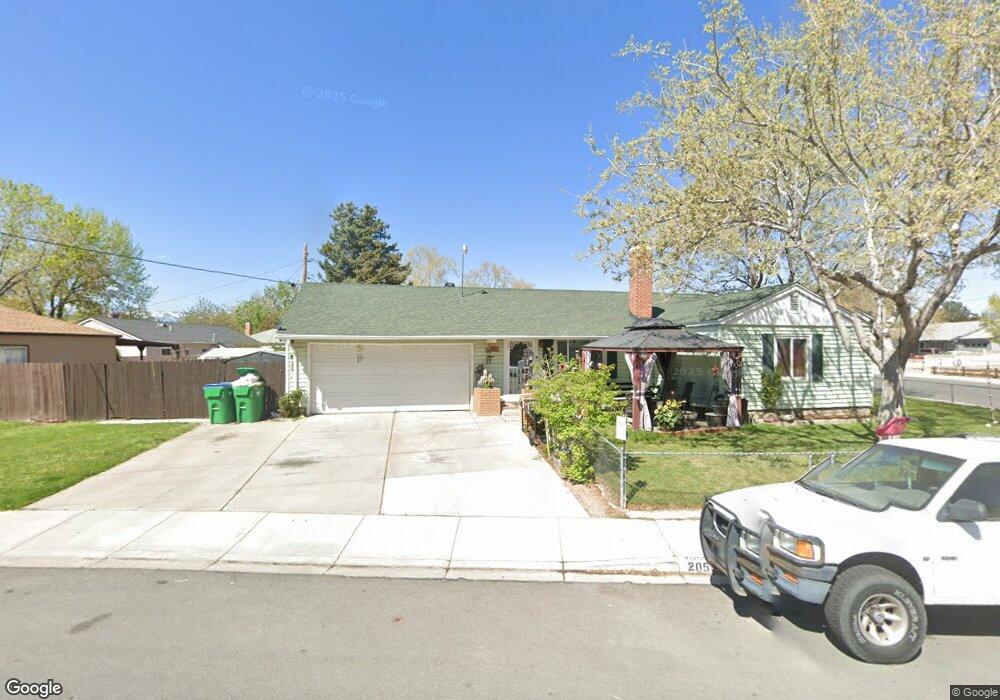
2059 11th St Sparks, NV 89431
North Rock NeighborhoodEstimated Value: $381,843 - $414,000
3
Beds
1
Bath
1,092
Sq Ft
$364/Sq Ft
Est. Value
About This Home
This home is located at 2059 11th St, Sparks, NV 89431 and is currently estimated at $396,961, approximately $363 per square foot. 2059 11th St is a home located in Washoe County with nearby schools including Alice Maxwell Elementary School, Sparks Middle School, and Sparks High School.
Ownership History
Date
Name
Owned For
Owner Type
Purchase Details
Closed on
Sep 22, 2015
Sold by
Bandt Emma Anne
Bought by
Barker Keri Lee and Barker Lorane Eileene
Current Estimated Value
Create a Home Valuation Report for This Property
The Home Valuation Report is an in-depth analysis detailing your home's value as well as a comparison with similar homes in the area
Home Values in the Area
Average Home Value in this Area
Purchase History
| Date | Buyer | Sale Price | Title Company |
|---|---|---|---|
| Barker Keri Lee | -- | None Available |
Source: Public Records
Tax History
| Year | Tax Paid | Tax Assessment Tax Assessment Total Assessment is a certain percentage of the fair market value that is determined by local assessors to be the total taxable value of land and additions on the property. | Land | Improvement |
|---|---|---|---|---|
| 2026 | $536 | $52,094 | $33,600 | $18,494 |
| 2025 | $704 | $49,675 | $31,325 | $18,350 |
| 2024 | $704 | $47,769 | $30,100 | $17,669 |
| 2023 | $684 | $46,169 | $29,890 | $16,279 |
| 2022 | $664 | $38,364 | $25,095 | $13,269 |
| 2021 | $646 | $29,700 | $16,765 | $12,935 |
| 2020 | $625 | $29,047 | $16,345 | $12,702 |
| 2019 | $607 | $27,920 | $15,890 | $12,030 |
| 2018 | $590 | $22,772 | $11,235 | $11,537 |
| 2017 | $574 | $21,493 | $10,150 | $11,343 |
| 2016 | $559 | $19,548 | $8,225 | $11,323 |
| 2015 | $284 | $18,367 | $7,140 | $11,227 |
| 2014 | $541 | $17,089 | $6,440 | $10,649 |
| 2013 | -- | $14,315 | $3,955 | $10,360 |
Source: Public Records
Map
Nearby Homes
- 1025 Tyler Way
- 1023 Tyler Way
- 1003 Sbragia Way
- 1305 Sbragia Way
- 1540 Tyler Way
- 1110 Dodson Way
- 1250 Oxford Ave
- 2263 Oppio St
- 1665 London Cir
- 705 York Way
- 2455 Coppa Way
- 1945 4th St Unit 33
- 1945 4th St Unit 22
- 1945 4th St Unit 51
- 1731 Gault Way Unit D
- 1940 4th St Unit 20
- 1940 4th St Unit 51
- 1940 4th St Unit 46
- 1010 12th St
- 985 10th St
Your Personal Tour Guide
Ask me questions while you tour the home.