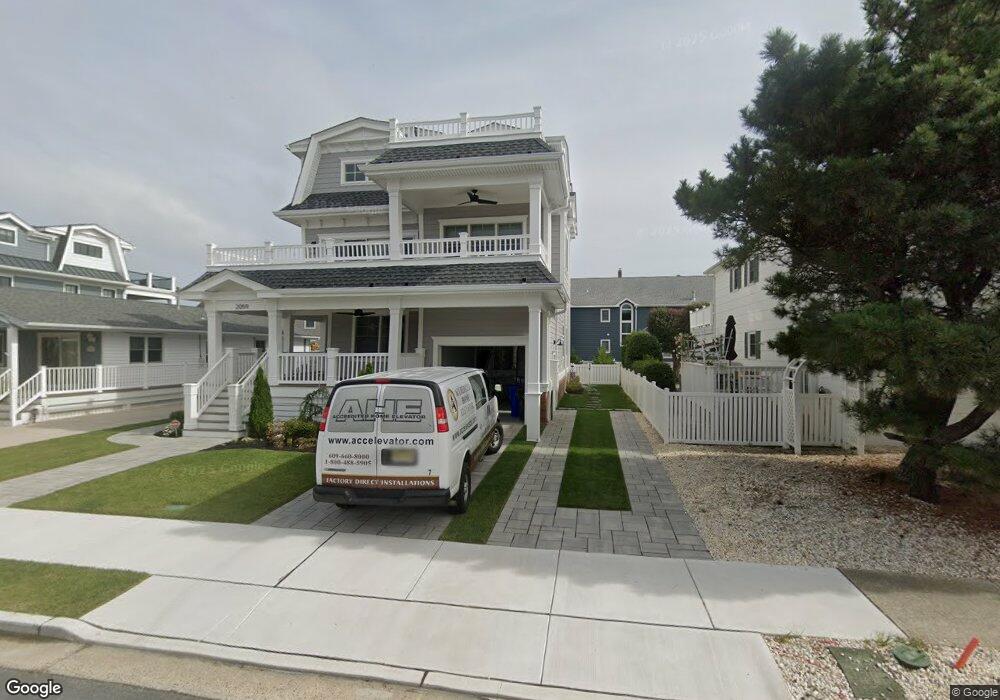
2059 1st Ave Avalon, NJ 08202
Estimated Value: $4,532,440 - $4,846,000
Studio
--
Bath
1,170
Sq Ft
$4,008/Sq Ft
Est. Value
About This Home
This home is located at 2059 1st Ave, Avalon, NJ 08202 and is currently estimated at $4,689,220, approximately $4,007 per square foot. 2059 1st Ave is a home located in Cape May County with nearby schools including Avalon Elementary School.
Ownership History
Date
Name
Owned For
Owner Type
Purchase Details
Closed on
Jan 28, 2025
Sold by
Welsh Thomas J
Bought by
Hanawalt Scott Anthony and Hanawalt Jill Mai
Current Estimated Value
Home Financials for this Owner
Home Financials are based on the most recent Mortgage that was taken out on this home.
Original Mortgage
$3,596,000
Outstanding Balance
$3,455,626
Interest Rate
5.92%
Mortgage Type
New Conventional
Estimated Equity
$1,233,594
Purchase Details
Closed on
Oct 26, 2023
Sold by
Post Marinanci
Bought by
Welsh Thomas J
Home Financials for this Owner
Home Financials are based on the most recent Mortgage that was taken out on this home.
Original Mortgage
$2,750,000
Interest Rate
7.19%
Mortgage Type
Construction
Purchase Details
Closed on
May 21, 2006
Sold by
Baron John B
Bought by
The Rev John B Baron 2006 Qprt and Baron John B
Create a Home Valuation Report for This Property
The Home Valuation Report is an in-depth analysis detailing your home's value as well as a comparison with similar homes in the area
Home Values in the Area
Average Home Value in this Area
Purchase History
| Date | Buyer | Sale Price | Title Company |
|---|---|---|---|
| Hanawalt Scott Anthony | $4,495,000 | Seaboard Title | |
| Hanawalt Scott Anthony | $4,495,000 | Seaboard Title | |
| Welsh Thomas J | $2,050,000 | Fidelity National Title | |
| Post Marinanci | -- | Seaboard Title | |
| The Rev John B Baron 2006 Qprt | -- | None Available |
Source: Public Records
Mortgage History
| Date | Status | Borrower | Loan Amount |
|---|---|---|---|
| Open | Hanawalt Scott Anthony | $3,596,000 | |
| Closed | Hanawalt Scott Anthony | $3,596,000 | |
| Previous Owner | Welsh Thomas J | $2,750,000 |
Source: Public Records
Tax History
| Year | Tax Paid | Tax Assessment Tax Assessment Total Assessment is a certain percentage of the fair market value that is determined by local assessors to be the total taxable value of land and additions on the property. | Land | Improvement |
|---|---|---|---|---|
| 2025 | $7,506 | $1,200,000 | $1,200,000 | -- |
| 2024 | $7,506 | $1,222,400 | $1,200,000 | $22,400 |
Source: Public Records
Map
Nearby Homes
- 76 21st St W
- 118 22nd St
- 2023 Dune Dr Unit R6
- 1838 First Ave
- 178 19th St
- 174 23rd St
- 211 23rd St
- 53 25th St E
- 40 15th St W
- 212 25th St Unit End Unit
- 58 15th St E
- 179 27th St
- 74 26th St E
- 16 4th Ave
- 1668 Ocean Dr Unit B1
- 8 27th St Unit West
- 2425 Harbor Ave Unit 2425
- 389 22nd St
- 34 13th St W
- 74 13th St W
Your Personal Tour Guide
Ask me questions while you tour the home.