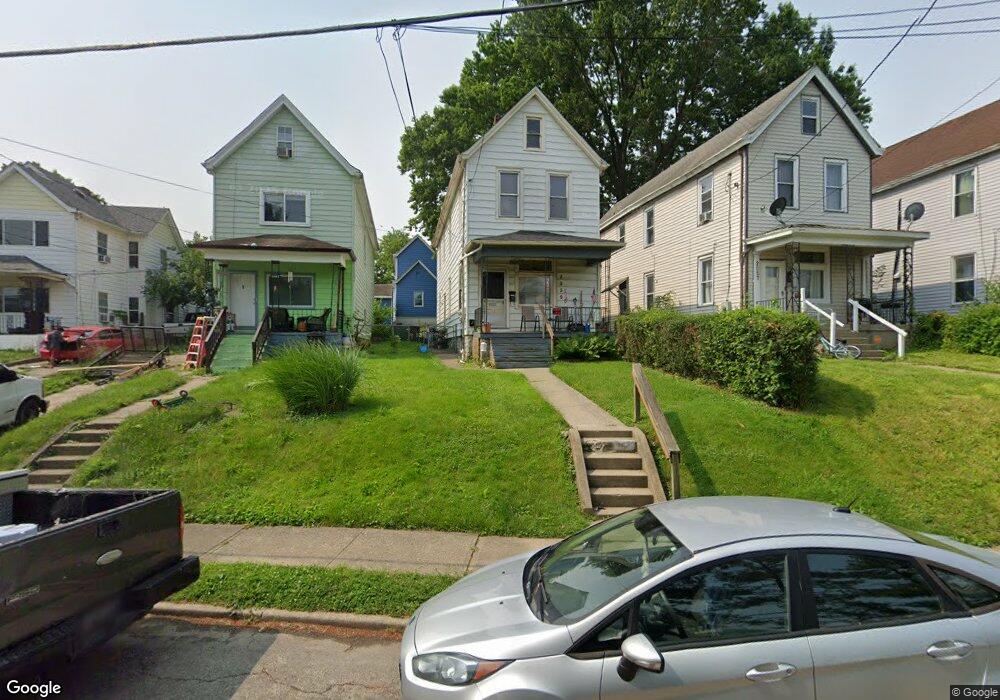
2059 Foraker Ave Cincinnati, OH 45212
Estimated Value: $174,000 - $262,000
3
Beds
1
Bath
2,192
Sq Ft
$96/Sq Ft
Est. Value
About This Home
This home is located at 2059 Foraker Ave, Cincinnati, OH 45212 and is currently estimated at $210,408, approximately $95 per square foot. 2059 Foraker Ave is a home located in Hamilton County with nearby schools including Norwood High School, Cornerstone Christian Academy, and Immaculate Conception Academy.
Ownership History
Date
Name
Owned For
Owner Type
Purchase Details
Closed on
Oct 31, 1998
Sold by
Stein Thomas and Whaley Floyd B
Bought by
Vuozzo Andrew
Current Estimated Value
Purchase Details
Closed on
Jul 14, 1994
Sold by
Bin Borin and Bin Chhay Hong
Bought by
Stein Thomas J and Whaley Floyd B
Home Financials for this Owner
Home Financials are based on the most recent Mortgage that was taken out on this home.
Original Mortgage
$35,250
Interest Rate
8.6%
Purchase Details
Closed on
May 31, 1994
Sold by
Conners Winnie
Bought by
Lascalea Nicholas J
Home Financials for this Owner
Home Financials are based on the most recent Mortgage that was taken out on this home.
Original Mortgage
$35,250
Interest Rate
8.6%
Purchase Details
Closed on
May 24, 1994
Sold by
Jacobs Ann and Weeks Wanda
Bought by
Lascalea Nicholas J
Home Financials for this Owner
Home Financials are based on the most recent Mortgage that was taken out on this home.
Original Mortgage
$35,250
Interest Rate
8.6%
Create a Home Valuation Report for This Property
The Home Valuation Report is an in-depth analysis detailing your home's value as well as a comparison with similar homes in the area
Home Values in the Area
Average Home Value in this Area
Purchase History
| Date | Buyer | Sale Price | Title Company |
|---|---|---|---|
| Vuozzo Andrew | $48,000 | -- | |
| Stein Thomas J | -- | -- | |
| Lascalea Nicholas J | -- | -- | |
| Lascalea Nicholas J | -- | -- |
Source: Public Records
Mortgage History
| Date | Status | Borrower | Loan Amount |
|---|---|---|---|
| Previous Owner | Stein Thomas J | $35,250 |
Source: Public Records
Tax History
| Year | Tax Paid | Tax Assessment Tax Assessment Total Assessment is a certain percentage of the fair market value that is determined by local assessors to be the total taxable value of land and additions on the property. | Land | Improvement |
|---|---|---|---|---|
| 2025 | $2,211 | $41,504 | $7,207 | $34,297 |
| 2024 | $2,212 | $41,504 | $7,207 | $34,297 |
| 2023 | $2,224 | $41,504 | $7,207 | $34,297 |
| 2022 | $1,448 | $22,751 | $4,841 | $17,910 |
| 2021 | $1,435 | $22,751 | $4,841 | $17,910 |
| 2020 | $1,404 | $22,751 | $4,841 | $17,910 |
| 2019 | $1,338 | $19,958 | $4,246 | $15,712 |
| 2018 | $1,339 | $19,958 | $4,246 | $15,712 |
| 2017 | $1,281 | $19,958 | $4,246 | $15,712 |
| 2016 | $1,664 | $24,780 | $3,990 | $20,790 |
| 2015 | $1,471 | $24,780 | $3,990 | $20,790 |
| 2014 | $1,465 | $24,780 | $3,990 | $20,790 |
| 2013 | $1,542 | $26,363 | $4,246 | $22,117 |
Source: Public Records
Map
Nearby Homes
- 2030 Elm Ave
- 2005 Crown Ave
- 4719 Section Ave
- 1952 Maple Ave
- 2049 Sherman Ave
- 1907 Crown Ave
- 2043 Lawrence Ave
- 2134 Ross Ave
- 5123 Globe Ave
- 1915 Maple Ave
- 4923 Marion Ave
- 5126 Globe Ave
- 5121 Rolston Ave
- 1901 Sherman Ave
- 5119 Warren Ave
- 2310 Norwood Ave
- 1846 Cleveland Ave
- 5042 Wesley Ave
- 5044 Wesley Ave
- 5203 Rolston Ave
- 2061 Foraker Ave
- 2057 Foraker Ave
- 2055 Foraker Ave
- 2063 Foraker Ave
- 2053 Foraker Ave
- 2056 Crown Ave
- 2065 Foraker Ave
- 2052 Crown Ave
- 2048 Crown Ave
- 2054 Crown Ave
- 2067 Foraker Ave
- 2060 Crown Ave
- 2062 Crown Ave
- 2069 Foraker Ave
- 2045 Foraker Ave
- 2064 Crown Ave
- 2044 Crown Ave
- 2070 Crown Ave
- 2041 Foraker Ave
- 2040 Crown Ave
Your Personal Tour Guide
Ask me questions while you tour the home.