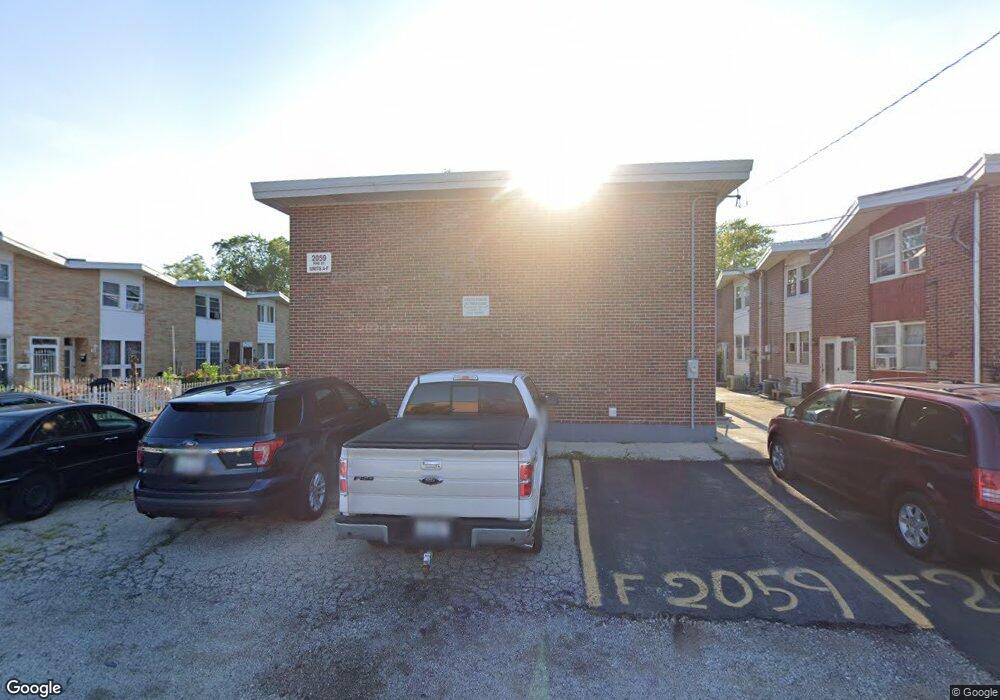
2059 Pine St Des Plaines, IL 60018
Estimated Value: $235,000 - $273,000
3
Beds
2
Baths
1,152
Sq Ft
$218/Sq Ft
Est. Value
About This Home
This home is located at 2059 Pine St, Des Plaines, IL 60018 and is currently estimated at $251,675, approximately $218 per square foot. 2059 Pine St is a home located in Cook County with nearby schools including Plainfield Elementary School, Algonquin Middle School, and Maine West High School.
Ownership History
Date
Name
Owned For
Owner Type
Purchase Details
Closed on
Oct 29, 2012
Sold by
Owb Reo Llc
Bought by
Patel Nitin and Patel Kamina
Current Estimated Value
Purchase Details
Closed on
Aug 22, 2012
Sold by
Chandarraju
Bought by
Owb Reo Llc
Purchase Details
Closed on
Jun 27, 2006
Sold by
Chandarraju Ram and Chandarraju Chandra
Bought by
Chandarraju Ram and Chandarraju Chandra
Home Financials for this Owner
Home Financials are based on the most recent Mortgage that was taken out on this home.
Original Mortgage
$130,000
Interest Rate
6.73%
Mortgage Type
New Conventional
Purchase Details
Closed on
Sep 17, 1993
Sold by
Patel Kamlesh and Patel Sharmi
Bought by
Chandarraju Ram and Chandarraju Chandra
Create a Home Valuation Report for This Property
The Home Valuation Report is an in-depth analysis detailing your home's value as well as a comparison with similar homes in the area
Home Values in the Area
Average Home Value in this Area
Purchase History
| Date | Buyer | Sale Price | Title Company |
|---|---|---|---|
| Patel Nitin | $63,500 | Fidelity National Title | |
| Owb Reo Llc | -- | None Available | |
| Chandarraju Ram | -- | Law Title Oak Brook | |
| Chandarraju Ram | $58,000 | -- |
Source: Public Records
Mortgage History
| Date | Status | Borrower | Loan Amount |
|---|---|---|---|
| Previous Owner | Chandarraju Ram | $130,000 |
Source: Public Records
Tax History
| Year | Tax Paid | Tax Assessment Tax Assessment Total Assessment is a certain percentage of the fair market value that is determined by local assessors to be the total taxable value of land and additions on the property. | Land | Improvement |
|---|---|---|---|---|
| 2025 | $4,586 | $19,000 | $2,816 | $16,184 |
| 2024 | $4,586 | $17,395 | $3,000 | $14,395 |
| 2023 | $4,889 | $19,000 | $3,000 | $16,000 |
| 2022 | $4,889 | $19,000 | $3,000 | $16,000 |
| 2021 | $3,677 | $11,961 | $1,196 | $10,765 |
| 2020 | $3,615 | $11,961 | $1,196 | $10,765 |
| 2019 | $3,617 | $13,440 | $1,196 | $12,244 |
| 2018 | $3,934 | $13,155 | $1,056 | $12,099 |
| 2017 | $3,865 | $13,155 | $1,056 | $12,099 |
| 2016 | $3,656 | $13,155 | $1,056 | $12,099 |
| 2015 | $3,467 | $11,467 | $915 | $10,552 |
| 2014 | $3,879 | $13,107 | $915 | $12,192 |
| 2013 | $3,782 | $13,107 | $915 | $12,192 |
Source: Public Records
Map
Nearby Homes
- 1370 Fargo Ave Unit E
- 1445 Everett Ave
- 1696 S Elm St
- 1689 S Elm St
- 1721 Prospect Ave
- 1645 Illinois St
- 1629 E Touhy Ave
- 1641 E Touhy Ave
- 1509 Center St
- 805 S Tures Ln
- 1922 Fargo Ave
- 1738 Lunt Ave
- 1541 Cooper St
- 1080 Bogart St
- 635 Birchwood Ave
- 815 E Oakton St Unit 311
- 2323 Douglas Ave
- 1640 S River Rd
- 614 Birchwood Ave
- 2646 Maple St
- 2059 Pine St
- 2059 Pine St
- 2059 Pine St
- 2059 Pine St
- 2059 Pine St
- 2059 Pine St Unit E
- 2059 Pine St Unit F
- 2059 Pine St Unit B
- 2059 Pine St Unit A
- 2059 Pine St Unit D
- 2057 Pine St
- 2041 Pine St
- 2041 Pine St
- 2041 Pine St
- 2041 Pine St
- 2041 Pine St
- 2041 Pine St
- 2041 Pine St Unit B
- 2063 Pine St
- 2045 Pine St
Your Personal Tour Guide
Ask me questions while you tour the home.