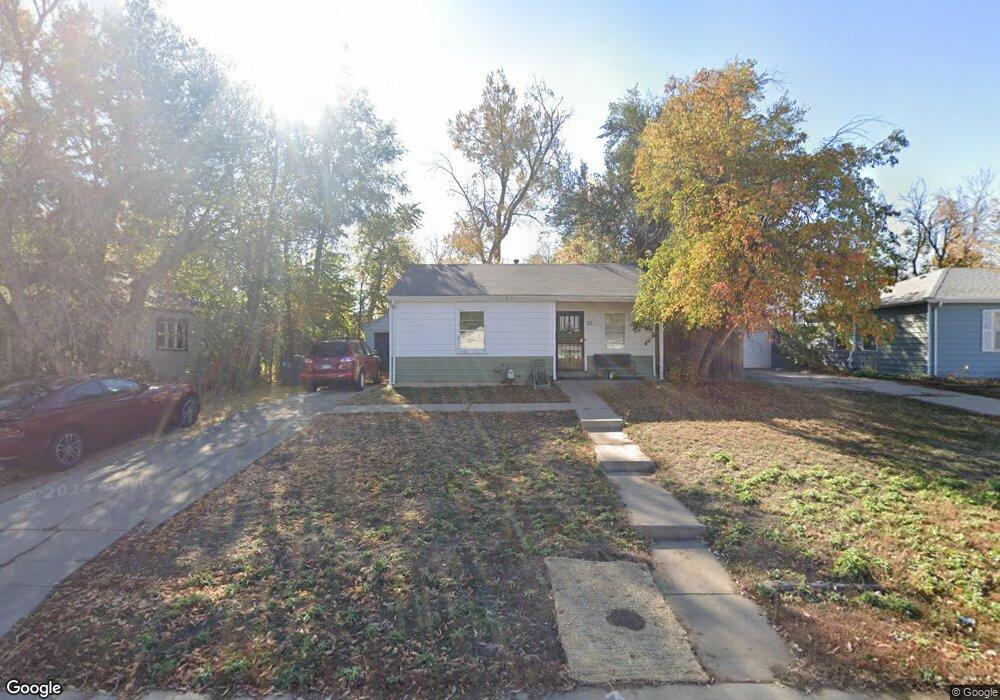
2059 S Julian Cir Denver, CO 80219
Harvey Park NeighborhoodEstimated Value: $395,710 - $422,000
3
Beds
1
Bath
975
Sq Ft
$422/Sq Ft
Est. Value
About This Home
This home is located at 2059 S Julian Cir, Denver, CO 80219 and is currently estimated at $411,178, approximately $421 per square foot. 2059 S Julian Cir is a home located in Denver County with nearby schools including Johnson Elementary School, Kepner Beacon Middle School, and West High School.
Ownership History
Date
Name
Owned For
Owner Type
Purchase Details
Closed on
Jul 15, 2004
Sold by
Murillo Medardo
Bought by
Sanchez Janice L
Current Estimated Value
Home Financials for this Owner
Home Financials are based on the most recent Mortgage that was taken out on this home.
Original Mortgage
$157,528
Outstanding Balance
$79,213
Interest Rate
6.32%
Mortgage Type
FHA
Estimated Equity
$331,965
Purchase Details
Closed on
Sep 20, 2002
Sold by
Murillo Medardo and Murillo Jesus Daniel
Bought by
Murillo Medardo
Home Financials for this Owner
Home Financials are based on the most recent Mortgage that was taken out on this home.
Original Mortgage
$102,000
Interest Rate
6.09%
Purchase Details
Closed on
Oct 3, 1997
Sold by
Obrien Alvin C and Peter Stephen
Bought by
Murillo O Medardo and Murillo Jesus Daniel
Home Financials for this Owner
Home Financials are based on the most recent Mortgage that was taken out on this home.
Original Mortgage
$92,587
Interest Rate
7.52%
Mortgage Type
FHA
Create a Home Valuation Report for This Property
The Home Valuation Report is an in-depth analysis detailing your home's value as well as a comparison with similar homes in the area
Home Values in the Area
Average Home Value in this Area
Purchase History
| Date | Buyer | Sale Price | Title Company |
|---|---|---|---|
| Sanchez Janice L | $160,000 | Av | |
| Murillo Medardo | -- | Transnation Title | |
| Murillo O Medardo | $93,000 | -- |
Source: Public Records
Mortgage History
| Date | Status | Borrower | Loan Amount |
|---|---|---|---|
| Open | Sanchez Janice L | $157,528 | |
| Previous Owner | Murillo Medardo | $102,000 | |
| Previous Owner | Murillo O Medardo | $92,587 |
Source: Public Records
Tax History Compared to Growth
Tax History
| Year | Tax Paid | Tax Assessment Tax Assessment Total Assessment is a certain percentage of the fair market value that is determined by local assessors to be the total taxable value of land and additions on the property. | Land | Improvement |
|---|---|---|---|---|
| 2024 | $1,917 | $24,210 | $1,760 | $22,450 |
| 2023 | $1,876 | $24,210 | $1,760 | $22,450 |
| 2022 | $1,775 | $22,320 | $5,650 | $16,670 |
| 2021 | $1,713 | $22,960 | $5,810 | $17,150 |
| 2020 | $1,545 | $20,820 | $5,280 | $15,540 |
| 2019 | $1,501 | $20,820 | $5,280 | $15,540 |
| 2018 | $1,278 | $16,520 | $4,520 | $12,000 |
| 2017 | $1,274 | $16,520 | $4,520 | $12,000 |
| 2016 | $1,057 | $12,960 | $4,999 | $7,961 |
| 2015 | $1,013 | $12,960 | $4,999 | $7,961 |
| 2014 | $755 | $9,090 | $2,945 | $6,145 |
Source: Public Records
Map
Nearby Homes
- 3440 W Evans Ave
- 2081 S King St
- 2105 S Hazel Ct
- 1910 S Knox Ct
- 1910 S King St
- 2285 S Knox Ct
- 3180 W Jewell Ave
- 1888 S Michigan Way
- 1863 S Lowell Blvd
- 2380 S Julian St
- 2236 S Osceola St
- 1845 S Mabry Way
- 2370 S Meade St
- 1801 S Grove St
- 2505 S Hooker St
- 3170 W Colorado Ave
- 1845 S Federal Blvd
- 3111 W Bails Place
- 3245 W Mexico Ave
- 3150 W Mexico Ave
- 2063 S Julian Cir
- 2053 S Julian Cir
- 2075 S Irving St
- 2085 S Irving St
- 2060 S Julian Cir
- 2049 S Julian Cir
- 3315 W Evans Ave
- 3325 W Evans Ave
- 3305 W Evans Ave
- 2065 S Irving St
- 2095 S Irving St
- 2050 S Julian Cir
- 3335 W Evans Ave
- 2055 S Irving St
- 2043 S Julian Cir
- 2040 S Julian Cir
- 3345 W Evans Ave
- 2039 S Julian Cir
- 2045 S Irving St
- 2060 S Irving St