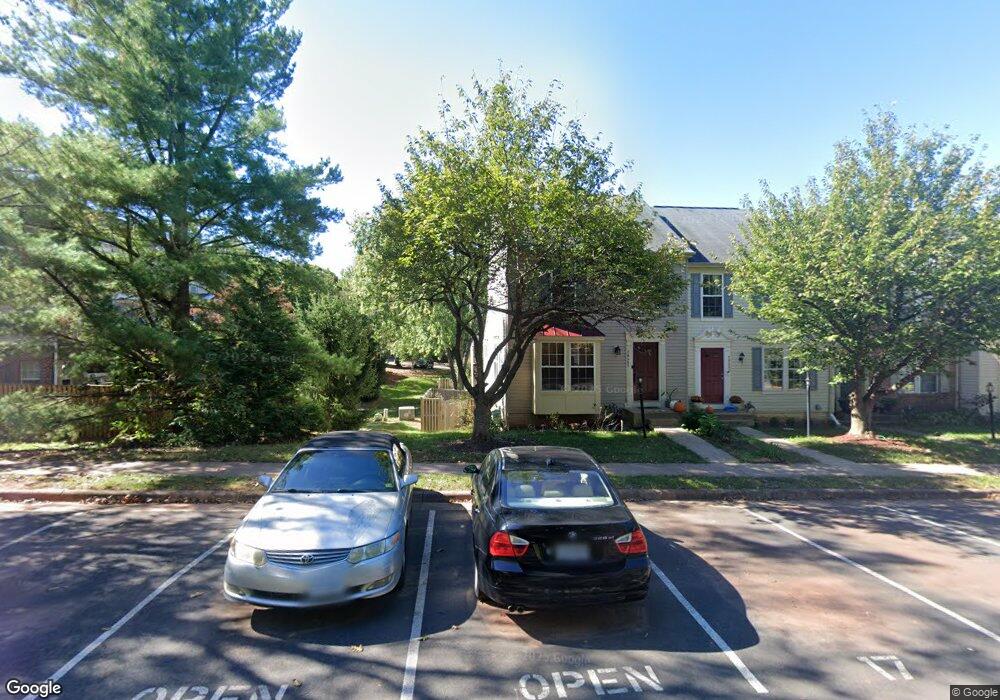
20597 Morningside Terrace Sterling, VA 20165
Estimated Value: $589,626 - $615,000
3
Beds
3
Baths
1,942
Sq Ft
$311/Sq Ft
Est. Value
About This Home
This home is located at 20597 Morningside Terrace, Sterling, VA 20165 and is currently estimated at $603,407, approximately $310 per square foot. 20597 Morningside Terrace is a home located in Loudoun County with nearby schools including Horizon Elementary School, River Bend Middle School, and Potomac Falls High School.
Ownership History
Date
Name
Owned For
Owner Type
Purchase Details
Closed on
Oct 25, 2011
Sold by
Brooks Deborah
Bought by
See Chen F and Liu Min
Current Estimated Value
Home Financials for this Owner
Home Financials are based on the most recent Mortgage that was taken out on this home.
Original Mortgage
$271,927
Outstanding Balance
$182,993
Interest Rate
3.75%
Mortgage Type
FHA
Estimated Equity
$420,414
Purchase Details
Closed on
Oct 17, 2006
Sold by
Shue Jason W
Bought by
Brooks Deborah
Home Financials for this Owner
Home Financials are based on the most recent Mortgage that was taken out on this home.
Original Mortgage
$290,850
Interest Rate
6.49%
Mortgage Type
New Conventional
Purchase Details
Closed on
Jul 28, 1997
Sold by
Nvr Homes Inc
Bought by
Shue Jason W and Shue Kristine A
Home Financials for this Owner
Home Financials are based on the most recent Mortgage that was taken out on this home.
Original Mortgage
$115,650
Interest Rate
7.7%
Mortgage Type
New Conventional
Create a Home Valuation Report for This Property
The Home Valuation Report is an in-depth analysis detailing your home's value as well as a comparison with similar homes in the area
Home Values in the Area
Average Home Value in this Area
Purchase History
| Date | Buyer | Sale Price | Title Company |
|---|---|---|---|
| See Chen F | $279,000 | -- | |
| Brooks Deborah | $363,600 | -- | |
| Shue Jason W | $154,240 | -- |
Source: Public Records
Mortgage History
| Date | Status | Borrower | Loan Amount |
|---|---|---|---|
| Open | See Chen F | $271,927 | |
| Previous Owner | Brooks Deborah | $290,850 | |
| Previous Owner | Shue Jason W | $115,650 |
Source: Public Records
Tax History Compared to Growth
Tax History
| Year | Tax Paid | Tax Assessment Tax Assessment Total Assessment is a certain percentage of the fair market value that is determined by local assessors to be the total taxable value of land and additions on the property. | Land | Improvement |
|---|---|---|---|---|
| 2025 | $4,388 | $545,070 | $193,500 | $351,570 |
| 2024 | $4,534 | $524,110 | $178,500 | $345,610 |
| 2023 | $4,313 | $492,920 | $178,500 | $314,420 |
| 2022 | $4,170 | $468,570 | $153,500 | $315,070 |
| 2021 | $4,121 | $420,540 | $133,500 | $287,040 |
| 2020 | $4,073 | $393,560 | $128,500 | $265,060 |
| 2019 | $3,988 | $381,660 | $128,500 | $253,160 |
| 2018 | $3,979 | $366,770 | $128,500 | $238,270 |
| 2017 | $3,974 | $353,270 | $128,500 | $224,770 |
| 2016 | $4,032 | $352,160 | $0 | $0 |
| 2015 | $4,106 | $233,250 | $0 | $233,250 |
| 2014 | $4,150 | $230,810 | $0 | $230,810 |
Source: Public Records
Map
Nearby Homes
- 20544 Morningside Terrace
- 46809 Trailwood Place
- 20597 Glenmere Square
- 126 Hillsdale Dr
- 46685 Joubert Terrace
- 20687 Smithfield Ct
- 46675 Cavendish Square
- 203 Greenfield Ct
- 46622 Drysdale Terrace Unit 100
- 20419 Riverbend Square Unit 301
- 105 Woodgate Ct
- 110 Sugarland Run Dr
- 46608 Drysdale Terrace Unit 101
- 46606 Drysdale Terrace Unit 101
- 229 W Meadowland Ln
- 86 Sugarland Run Dr
- 6 Sugarland Square Ct
- 28 Howard Place
- 32 Regis Cir
- 47277 Ox Bow Cir
- 20595 Morningside Terrace
- 20593 Morningside Terrace
- 20591 Morningside Terrace
- 20589 Morningside Terrace
- 20601 Morningside Terrace
- 20603 Morningside Terrace
- 20479 Morningside Terrace
- 20605 Morningside Terrace
- 20481 Morningside Terrace
- 20483 Morningside Terrace
- 20587 Morningside Terrace
- 20607 Morningside Terrace
- 20485 Morningside Terrace
- 20609 Morningside Terrace
- 20585 Morningside Terrace
- 20487 Morningside Terrace
- 20611 Morningside Terrace
- 20489 Morningside Terrace
- 20583 Morningside Terrace
- 20613 Morningside Terrace