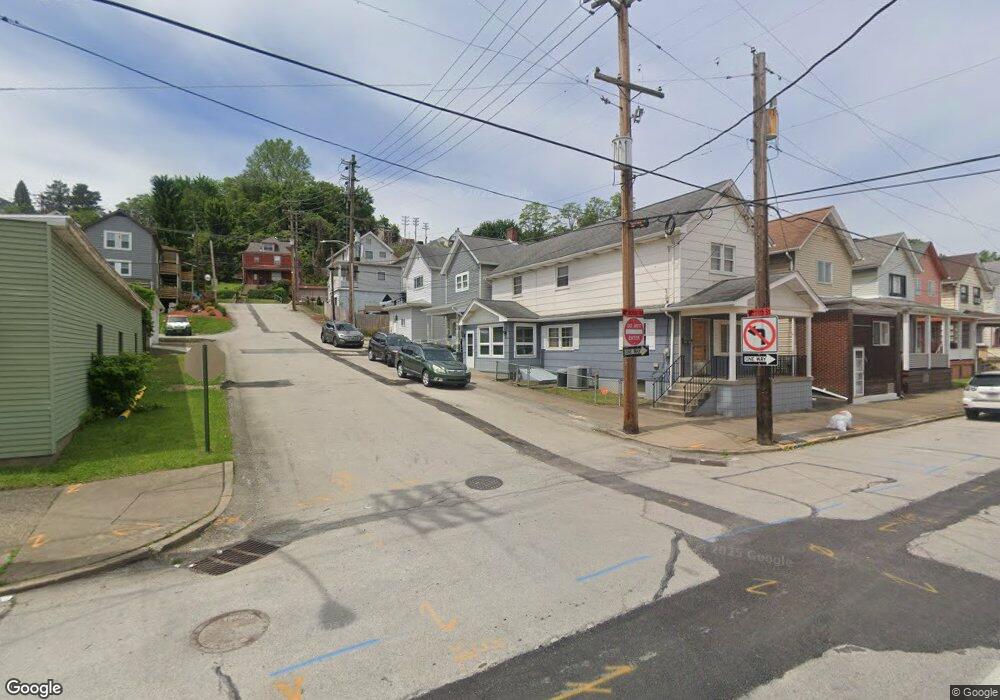
206 11th St Charleroi, PA 15022
Estimated Value: $50,000 - $106,000
3
Beds
3
Baths
1,728
Sq Ft
$51/Sq Ft
Est. Value
About This Home
This home is located at 206 11th St, Charleroi, PA 15022 and is currently estimated at $88,378, approximately $51 per square foot. 206 11th St is a home located in Washington County with nearby schools including Charleroi Elementary Center, Charleroi Area Middle School, and Charleroi Area High School.
Ownership History
Date
Name
Owned For
Owner Type
Purchase Details
Closed on
Sep 8, 2023
Sold by
Mon Valley Property Group Llc
Bought by
Valley Dream Homes Llc
Current Estimated Value
Purchase Details
Closed on
Feb 1, 2021
Sold by
Patty Ruth Llc
Bought by
Mon Valley Property Group Llc
Purchase Details
Closed on
Feb 11, 2019
Sold by
Valley Dream Homes Llc
Bought by
Patty Ruth Llc
Purchase Details
Closed on
Jun 23, 2016
Sold by
Washington Cnty Tax Claim Bureau
Bought by
Valley Dream Homes Llc
Create a Home Valuation Report for This Property
The Home Valuation Report is an in-depth analysis detailing your home's value as well as a comparison with similar homes in the area
Home Values in the Area
Average Home Value in this Area
Purchase History
| Date | Buyer | Sale Price | Title Company |
|---|---|---|---|
| Valley Dream Homes Llc | -- | None Listed On Document | |
| Mon Valley Property Group Llc | $20,000 | None Available | |
| Patty Ruth Llc | $72,710 | None Available | |
| Valley Dream Homes Llc | $4,000 | None Available |
Source: Public Records
Tax History Compared to Growth
Tax History
| Year | Tax Paid | Tax Assessment Tax Assessment Total Assessment is a certain percentage of the fair market value that is determined by local assessors to be the total taxable value of land and additions on the property. | Land | Improvement |
|---|---|---|---|---|
| 2025 | $1,523 | $48,300 | $8,600 | $39,700 |
| 2024 | $1,339 | $48,300 | $8,600 | $39,700 |
| 2023 | $1,339 | $48,300 | $8,600 | $39,700 |
| 2022 | $1,297 | $48,300 | $8,600 | $39,700 |
| 2021 | $1,297 | $48,300 | $8,600 | $39,700 |
| 2020 | $1,266 | $48,300 | $8,600 | $39,700 |
| 2019 | $1,210 | $48,300 | $8,600 | $39,700 |
| 2018 | $1,139 | $48,300 | $8,600 | $39,700 |
| 2017 | $203 | $48,300 | $8,600 | $39,700 |
| 2016 | $203 | $8,163 | $758 | $7,405 |
| 2015 | -- | $8,163 | $758 | $7,405 |
| 2014 | $203 | $8,163 | $758 | $7,405 |
| 2013 | $203 | $8,163 | $758 | $7,405 |
Source: Public Records
Map
Nearby Homes