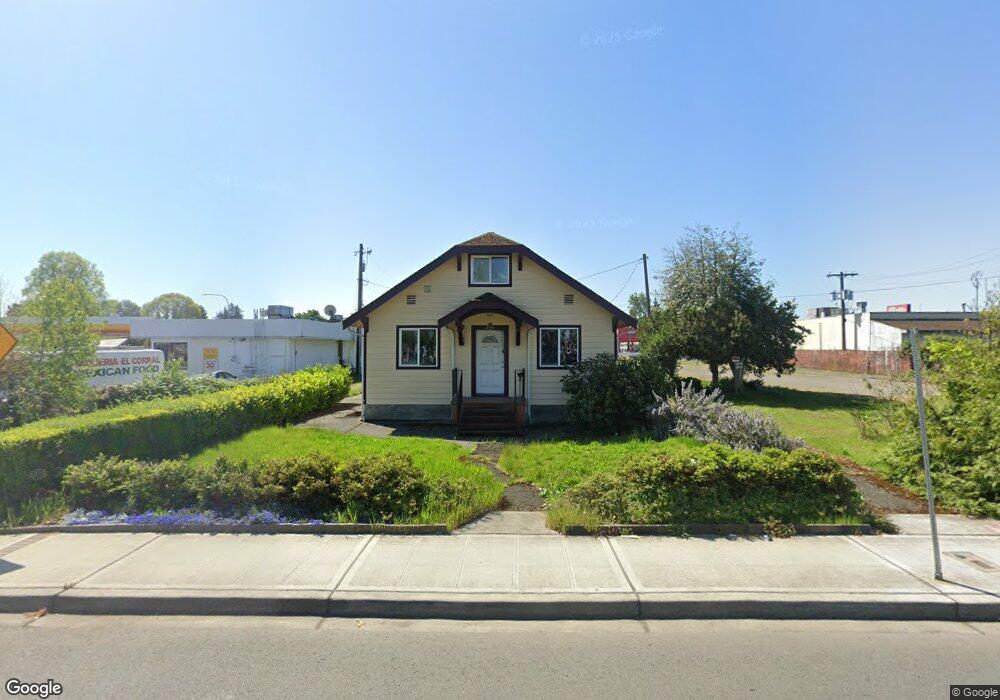
206 2nd St SE Auburn, WA 98002
Downtown Auburn NeighborhoodEstimated Value: $435,000 - $474,000
3
Beds
1
Bath
1,352
Sq Ft
$338/Sq Ft
Est. Value
About This Home
This home is located at 206 2nd St SE, Auburn, WA 98002 and is currently estimated at $456,541, approximately $337 per square foot. 206 2nd St SE is a home located in King County with nearby schools including Washington Elementary School, Cascade Middle School, and Auburn High School.
Ownership History
Date
Name
Owned For
Owner Type
Purchase Details
Closed on
Apr 13, 2006
Sold by
Merrill Thomas Charles and Hansen Jean A
Bought by
Lee Sandy and Lee Tammy Lock
Current Estimated Value
Home Financials for this Owner
Home Financials are based on the most recent Mortgage that was taken out on this home.
Original Mortgage
$192,000
Interest Rate
5.98%
Mortgage Type
Fannie Mae Freddie Mac
Purchase Details
Closed on
Jun 30, 2005
Sold by
Hansen George D and Hansen Jean A
Bought by
Merrill Thomas Charles A and Hansen Jean A
Purchase Details
Closed on
Mar 15, 1996
Sold by
Merrill Charles A
Bought by
Hansen George D and Hansen Jean A
Create a Home Valuation Report for This Property
The Home Valuation Report is an in-depth analysis detailing your home's value as well as a comparison with similar homes in the area
Home Values in the Area
Average Home Value in this Area
Purchase History
| Date | Buyer | Sale Price | Title Company |
|---|---|---|---|
| Lee Sandy | $240,000 | The Talon Grou | |
| Merrill Thomas Charles A | -- | Chicago Title | |
| Hansen George D | -- | Transamerica Title Ins Compa |
Source: Public Records
Mortgage History
| Date | Status | Borrower | Loan Amount |
|---|---|---|---|
| Closed | Lee Sandy | $192,000 |
Source: Public Records
Tax History Compared to Growth
Tax History
| Year | Tax Paid | Tax Assessment Tax Assessment Total Assessment is a certain percentage of the fair market value that is determined by local assessors to be the total taxable value of land and additions on the property. | Land | Improvement |
|---|---|---|---|---|
| 2024 | $5,263 | $434,000 | $110,000 | $324,000 |
| 2023 | $4,678 | $382,000 | $88,000 | $294,000 |
| 2022 | $4,315 | $399,000 | $96,000 | $303,000 |
| 2021 | $4,035 | $317,000 | $77,000 | $240,000 |
| 2020 | $3,691 | $280,000 | $72,000 | $208,000 |
| 2018 | $3,832 | $269,000 | $72,000 | $197,000 |
| 2017 | $3,159 | $239,000 | $66,000 | $173,000 |
| 2016 | $2,786 | $195,000 | $63,000 | $132,000 |
| 2015 | $2,746 | $182,000 | $58,000 | $124,000 |
| 2014 | -- | $174,000 | $55,000 | $119,000 |
| 2013 | -- | $133,000 | $50,000 | $83,000 |
Source: Public Records
Map
Nearby Homes