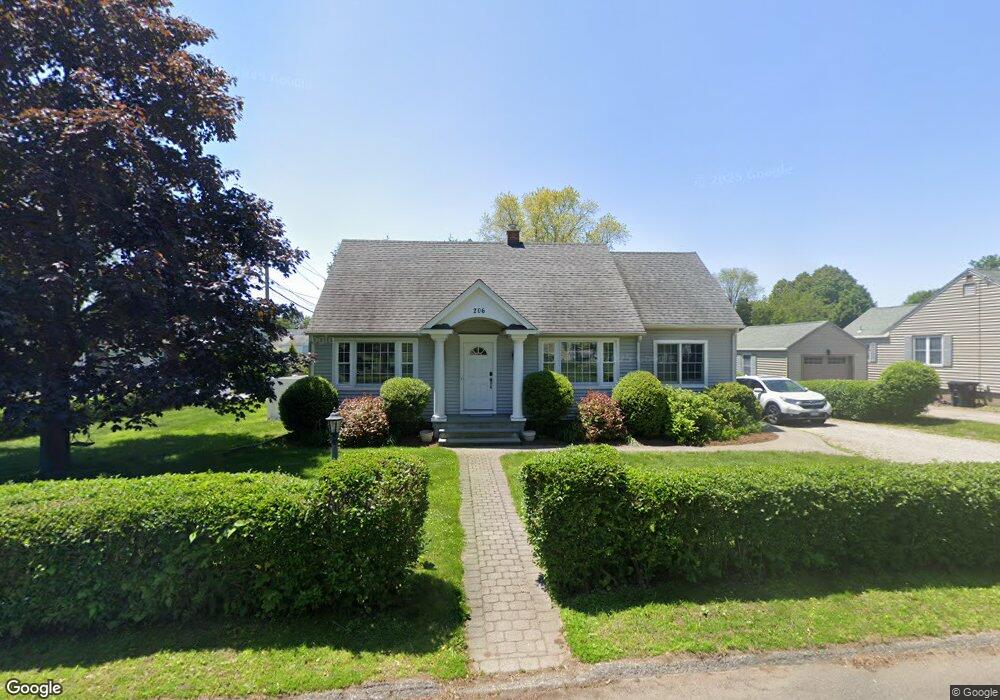
206 3rd Ave Milford, CT 06460
Devon NeighborhoodEstimated Value: $632,000 - $684,000
3
Beds
2
Baths
1,331
Sq Ft
$495/Sq Ft
Est. Value
About This Home
This home is located at 206 3rd Ave, Milford, CT 06460 and is currently estimated at $658,409, approximately $494 per square foot. 206 3rd Ave is a home located in New Haven County with nearby schools including Pumpkin Delight School, West Shore Middle School, and Jonathan Law High School.
Ownership History
Date
Name
Owned For
Owner Type
Purchase Details
Closed on
Jun 28, 2010
Sold by
Barbara M Heranadez T
Bought by
Renzulli Glenn and Renzulli June
Current Estimated Value
Home Financials for this Owner
Home Financials are based on the most recent Mortgage that was taken out on this home.
Original Mortgage
$100,000
Outstanding Balance
$67,309
Interest Rate
4.98%
Estimated Equity
$591,100
Create a Home Valuation Report for This Property
The Home Valuation Report is an in-depth analysis detailing your home's value as well as a comparison with similar homes in the area
Home Values in the Area
Average Home Value in this Area
Purchase History
| Date | Buyer | Sale Price | Title Company |
|---|---|---|---|
| Renzulli Glenn | $328,000 | -- | |
| Renzulli Glenn | $328,000 | -- |
Source: Public Records
Mortgage History
| Date | Status | Borrower | Loan Amount |
|---|---|---|---|
| Open | Renzulli Glenn | $100,000 | |
| Closed | Renzulli Glenn | $100,000 |
Source: Public Records
Tax History Compared to Growth
Tax History
| Year | Tax Paid | Tax Assessment Tax Assessment Total Assessment is a certain percentage of the fair market value that is determined by local assessors to be the total taxable value of land and additions on the property. | Land | Improvement |
|---|---|---|---|---|
| 2025 | $9,014 | $305,050 | $147,470 | $157,580 |
| 2024 | $8,889 | $305,050 | $147,470 | $157,580 |
| 2023 | $8,288 | $305,050 | $147,470 | $157,580 |
| 2022 | $8,130 | $305,050 | $147,470 | $157,580 |
| 2021 | $7,020 | $253,890 | $104,160 | $149,730 |
| 2020 | $7,028 | $253,890 | $104,160 | $149,730 |
| 2019 | $7,035 | $253,890 | $104,160 | $149,730 |
| 2018 | $7,043 | $253,890 | $104,160 | $149,730 |
| 2017 | $7,056 | $253,890 | $104,160 | $149,730 |
| 2016 | $6,848 | $245,980 | $97,650 | $148,330 |
| 2015 | $6,858 | $245,980 | $97,650 | $148,330 |
| 2014 | $6,696 | $245,980 | $97,650 | $148,330 |
Source: Public Records
Map
Nearby Homes