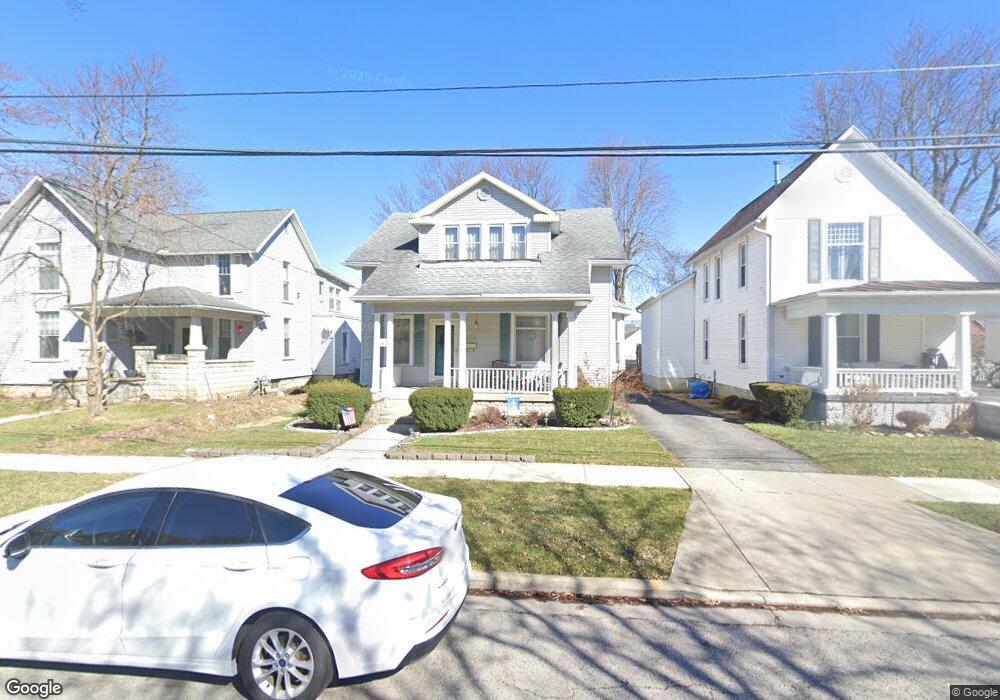
206 Baldwin Ave Findlay, OH 45840
Estimated Value: $201,736 - $228,000
3
Beds
2
Baths
1,505
Sq Ft
$143/Sq Ft
Est. Value
About This Home
This home is located at 206 Baldwin Ave, Findlay, OH 45840 and is currently estimated at $215,184, approximately $142 per square foot. 206 Baldwin Ave is a home located in Hancock County with nearby schools including Lincoln Elementary School, Donnell Middle School, and Findlay High School.
Ownership History
Date
Name
Owned For
Owner Type
Purchase Details
Closed on
Jul 29, 2010
Sold by
Thomas Travis W and Thomas Jessica L
Bought by
Tuck Gregory S and Tuck Georgine
Current Estimated Value
Home Financials for this Owner
Home Financials are based on the most recent Mortgage that was taken out on this home.
Original Mortgage
$103,272
Outstanding Balance
$67,683
Interest Rate
4.37%
Mortgage Type
FHA
Estimated Equity
$147,501
Purchase Details
Closed on
May 17, 2004
Sold by
Kapeluck Roger F and Pilstl Virginia L
Bought by
Thomas Travis W and Thomas Jessica L
Home Financials for this Owner
Home Financials are based on the most recent Mortgage that was taken out on this home.
Original Mortgage
$120,900
Interest Rate
4.75%
Mortgage Type
Purchase Money Mortgage
Purchase Details
Closed on
Dec 5, 1986
Bought by
Pilstl Virginia L and Kapeluck Roger
Purchase Details
Closed on
Aug 26, 1985
Bought by
Brown Michal A and Brown Helen M
Purchase Details
Closed on
Jun 12, 1981
Bought by
Fox Robert J and Fox Cynthia J
Create a Home Valuation Report for This Property
The Home Valuation Report is an in-depth analysis detailing your home's value as well as a comparison with similar homes in the area
Home Values in the Area
Average Home Value in this Area
Purchase History
| Date | Buyer | Sale Price | Title Company |
|---|---|---|---|
| Tuck Gregory S | $107,000 | Mid Am Title Agency | |
| Thomas Travis W | $131,900 | -- | |
| Pilstl Virginia L | $62,000 | -- | |
| Brown Michal A | $58,000 | -- | |
| Fox Robert J | -- | -- |
Source: Public Records
Mortgage History
| Date | Status | Borrower | Loan Amount |
|---|---|---|---|
| Open | Tuck Gregory S | $103,272 | |
| Closed | Thomas Travis W | $120,900 |
Source: Public Records
Tax History
| Year | Tax Paid | Tax Assessment Tax Assessment Total Assessment is a certain percentage of the fair market value that is determined by local assessors to be the total taxable value of land and additions on the property. | Land | Improvement |
|---|---|---|---|---|
| 2024 | $1,877 | $52,850 | $7,050 | $45,800 |
| 2023 | $1,880 | $52,850 | $7,050 | $45,800 |
| 2022 | $1,874 | $52,850 | $7,050 | $45,800 |
| 2021 | $1,769 | $43,460 | $7,230 | $36,230 |
| 2020 | $1,769 | $43,460 | $7,230 | $36,230 |
| 2019 | $1,733 | $43,460 | $7,230 | $36,230 |
| 2018 | $1,622 | $37,280 | $5,090 | $32,190 |
| 2017 | $810 | $37,280 | $5,090 | $32,190 |
| 2016 | $1,603 | $37,280 | $5,090 | $32,190 |
| 2015 | $1,232 | $28,180 | $4,360 | $23,820 |
| 2014 | $1,232 | $28,180 | $4,360 | $23,820 |
| 2012 | $1,244 | $28,180 | $4,360 | $23,820 |
Source: Public Records
Map
Nearby Homes
- 123 Glendale Ave
- 1304 Douglas Pkwy
- 206 Greenlawn Ave
- 324 W Mcpherson Ave
- 1113 Hurd Ave
- 216 1st St
- 865 S Main St
- 423 Elm St
- 412 Lima Ave
- 416 1/2 Lima Ave
- 860 Hurd Ave
- 845 Hurd Ave
- 829 Maple Ave
- 315 Fairlawn Place
- 331 Fairlawn Place
- 731 5th St
- 514 Liberty St
- 527 W Sandusky St
- 136 E Hobart Ave
- 209 E Hobart Ave
- 208 Baldwin Ave
- 210 Baldwin Ave
- 200 Baldwin Ave
- 130 Baldwin Ave
- 203 Baldwin Ave
- 201 Baldwin Ave
- 211 Baldwin Ave
- 124 Baldwin Ave
- 218 Baldwin Ave
- 201 Locust St
- 205 Baldwin Ave
- 222 Baldwin Ave
- 131 Baldwin Ave
- 120 Baldwin Ave
- 213 Baldwin Ave
- 226 Baldwin Ave
- 207 Locust St
- 121 Baldwin Ave
- 203 Locust St
- 209 Locust St
Your Personal Tour Guide
Ask me questions while you tour the home.