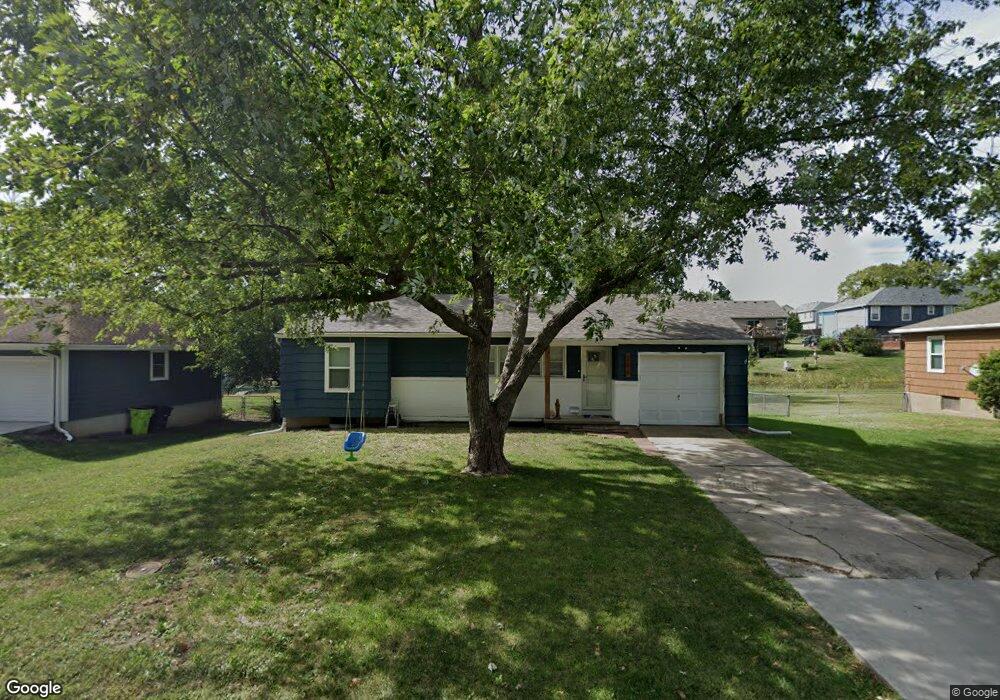
206 Baldwin St Belton, MO 64012
Estimated Value: $164,000 - $199,000
3
Beds
1
Bath
875
Sq Ft
$216/Sq Ft
Est. Value
About This Home
This home is located at 206 Baldwin St, Belton, MO 64012 and is currently estimated at $189,033, approximately $216 per square foot. 206 Baldwin St is a home located in Cass County with nearby schools including Cambridge Elementary School, Mill Creek Upper Elementary School, and Belton Middle School.
Ownership History
Date
Name
Owned For
Owner Type
Purchase Details
Closed on
Aug 5, 2020
Sold by
Boles Carol F and Carol F Boles Declaration Of T
Bought by
Fennesy Andrew J and Fennesy Emily A
Current Estimated Value
Home Financials for this Owner
Home Financials are based on the most recent Mortgage that was taken out on this home.
Original Mortgage
$89,240
Outstanding Balance
$78,955
Interest Rate
3.1%
Mortgage Type
New Conventional
Estimated Equity
$110,078
Create a Home Valuation Report for This Property
The Home Valuation Report is an in-depth analysis detailing your home's value as well as a comparison with similar homes in the area
Home Values in the Area
Average Home Value in this Area
Purchase History
| Date | Buyer | Sale Price | Title Company |
|---|---|---|---|
| Fennesy Andrew J | -- | Coffelt Land Title Inc |
Source: Public Records
Mortgage History
| Date | Status | Borrower | Loan Amount |
|---|---|---|---|
| Open | Fennesy Andrew J | $89,240 |
Source: Public Records
Tax History
| Year | Tax Paid | Tax Assessment Tax Assessment Total Assessment is a certain percentage of the fair market value that is determined by local assessors to be the total taxable value of land and additions on the property. | Land | Improvement |
|---|---|---|---|---|
| 2025 | $1,336 | $18,370 | $2,360 | $16,010 |
| 2024 | $1,336 | $16,200 | $2,140 | $14,060 |
| 2023 | $1,332 | $16,200 | $2,140 | $14,060 |
| 2022 | $1,176 | $14,170 | $2,140 | $12,030 |
| 2021 | $1,176 | $14,170 | $2,140 | $12,030 |
| 2020 | $1,152 | $13,800 | $2,140 | $11,660 |
| 2019 | $1,128 | $13,800 | $2,140 | $11,660 |
| 2018 | $985 | $12,150 | $1,710 | $10,440 |
| 2017 | $946 | $12,150 | $1,710 | $10,440 |
| 2016 | $946 | $11,600 | $1,710 | $9,890 |
| 2015 | $945 | $11,600 | $1,710 | $9,890 |
| 2014 | $949 | $11,600 | $1,710 | $9,890 |
| 2013 | -- | $11,600 | $1,710 | $9,890 |
Source: Public Records
Map
Nearby Homes
Your Personal Tour Guide
Ask me questions while you tour the home.