Estimated Value: $115,308 - $160,000
--
Bed
--
Bath
636
Sq Ft
$214/Sq Ft
Est. Value
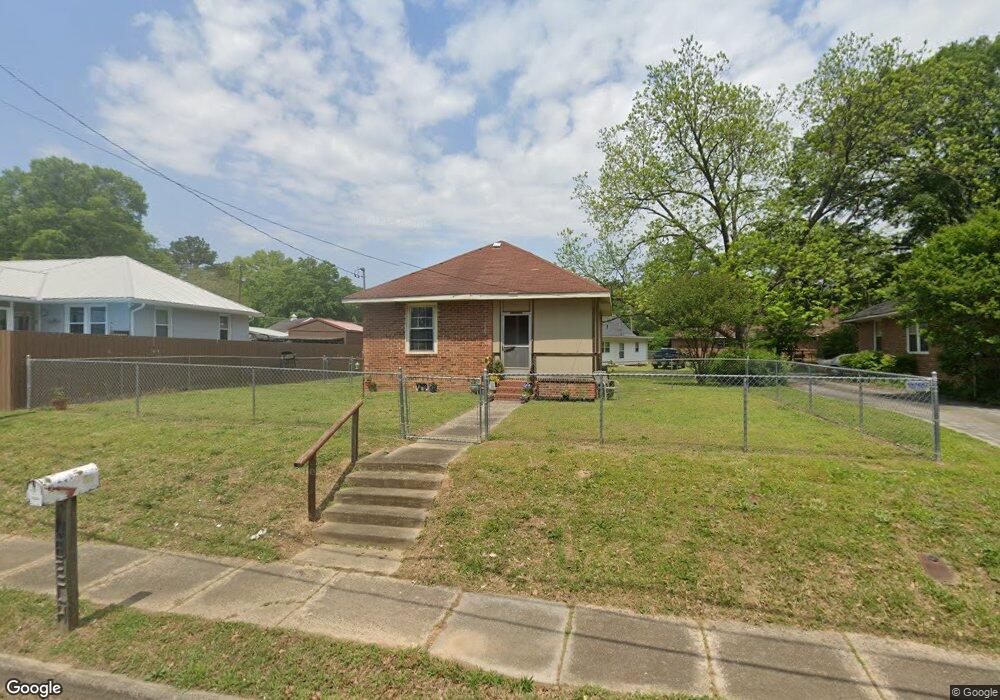
About This Home
This home is located at 206 Chatillon Rd NE, Rome, GA 30161 and is currently estimated at $136,327, approximately $214 per square foot. 206 Chatillon Rd NE is a home located in Floyd County with nearby schools including Model Middle School, Model High School, and Unity Christian School.
Ownership History
Date
Name
Owned For
Owner Type
Purchase Details
Closed on
Jan 31, 2014
Sold by
Knight Terry Lynn
Bought by
Clark Patricia J
Current Estimated Value
Home Financials for this Owner
Home Financials are based on the most recent Mortgage that was taken out on this home.
Original Mortgage
$31,500
Outstanding Balance
$24,005
Interest Rate
4.56%
Mortgage Type
New Conventional
Estimated Equity
$112,322
Purchase Details
Closed on
Jul 27, 2011
Sold by
Knight Terry Lynn
Bought by
Knight Terry Lynn
Purchase Details
Closed on
Sep 9, 2002
Sold by
Gray Charles F
Bought by
Knight William H
Purchase Details
Closed on
May 12, 2002
Sold by
Gray Helen
Bought by
Gray Charles F
Purchase Details
Closed on
Nov 4, 1994
Sold by
Gray Charles F and Gray Helen M
Bought by
Gray Helen
Purchase Details
Closed on
Mar 19, 1963
Bought by
Gray Charles F and Gray Helen M
Create a Home Valuation Report for This Property
The Home Valuation Report is an in-depth analysis detailing your home's value as well as a comparison with similar homes in the area
Home Values in the Area
Average Home Value in this Area
Purchase History
| Date | Buyer | Sale Price | Title Company |
|---|---|---|---|
| Clark Patricia J | $35,000 | -- | |
| Knight Terry Lynn | -- | -- | |
| Knight William H | $43,000 | -- | |
| Gray Charles F | -- | -- | |
| Gray Helen | -- | -- | |
| Gray Charles F | -- | -- |
Source: Public Records
Mortgage History
| Date | Status | Borrower | Loan Amount |
|---|---|---|---|
| Open | Clark Patricia J | $31,500 |
Source: Public Records
Tax History Compared to Growth
Tax History
| Year | Tax Paid | Tax Assessment Tax Assessment Total Assessment is a certain percentage of the fair market value that is determined by local assessors to be the total taxable value of land and additions on the property. | Land | Improvement |
|---|---|---|---|---|
| 2024 | $1,361 | $36,427 | $11,627 | $24,800 |
| 2023 | $1,080 | $32,769 | $10,509 | $22,260 |
| 2022 | $784 | $25,136 | $8,720 | $16,416 |
| 2021 | $721 | $22,657 | $8,050 | $14,607 |
| 2020 | $640 | $19,865 | $6,149 | $13,716 |
| 2019 | $589 | $18,499 | $6,149 | $12,350 |
| 2018 | $562 | $17,615 | $6,149 | $11,466 |
| 2017 | $547 | $17,095 | $6,149 | $10,946 |
| 2016 | $578 | $17,880 | $7,120 | $10,760 |
| 2015 | $515 | $15,120 | $2,880 | $12,240 |
| 2014 | $515 | $16,138 | $2,880 | $13,258 |
Source: Public Records
Map
Nearby Homes
- 0 Cypress St NE Unit 7494593
- 0 Cypress St NE Unit 10422946
- 1 Fir St NE
- 7 Ash St NE
- 42 Dogwood St NE
- 40 Dogwood St NE
- 23 Oak St NE
- 27 Oak St NE
- 205 Couper St NE
- 0 Euclid Ave Unit 10617853
- 311 Reynolds St NE
- 541 Reece St NE
- 2 Lindberg Dr NE
- 219 North Ave NE
- 411 Woodward St NE
- 7 Roseway Cir NE
- 3 Roseway Cir NE
- 302 Tolbert St
- 23 Reece St NE
- 204 Chatillon Rd NE
- 1 Cypress St NE
- 210 Chatillon Rd NE
- 3 Fir St NE
- 201 Chatillon Rd NE
- 2 Poplar St NE
- 0 Chatillon Rd
- 5 Fir St NE
- 212 Chatillon Rd NE
- 14 Cypress St NE
- 14 Cypress St NE
- 7 Fir St NE
- 10 Cypress St NE
- 12 Cypress St NE
- 0 Fir St NE Unit 7216256
- 0 Fir St NE Unit 8491677
- 0 Fir St NE Unit 8282960
- 4 Poplar St NE
- 8 Cypress St NE
- 1 Poplar St NE