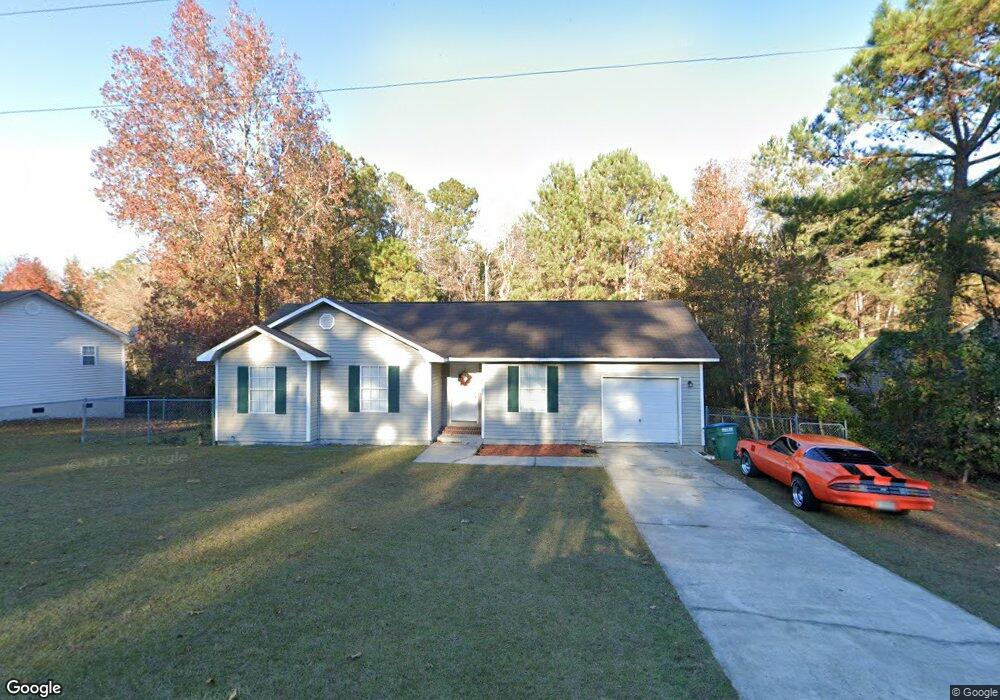
206 Deer Rd Springfield, GA 31329
Estimated Value: $237,368 - $252,000
3
Beds
2
Baths
1,124
Sq Ft
$215/Sq Ft
Est. Value
About This Home
This home is located at 206 Deer Rd, Springfield, GA 31329 and is currently estimated at $241,842, approximately $215 per square foot. 206 Deer Rd is a home located in Effingham County with nearby schools including Springfield Elementary School, Effingham County Middle School, and Effingham County High School.
Ownership History
Date
Name
Owned For
Owner Type
Purchase Details
Closed on
Jul 11, 2024
Sold by
Ledesma Ernest
Bought by
206 Deer Road Llc
Current Estimated Value
Purchase Details
Closed on
Mar 15, 2021
Sold by
Ledesma Investments Llc
Bought by
Ledesma Ernest and Bartiromo Kristina
Home Financials for this Owner
Home Financials are based on the most recent Mortgage that was taken out on this home.
Original Mortgage
$90,000
Interest Rate
2.73%
Mortgage Type
New Conventional
Purchase Details
Closed on
Sep 17, 2007
Bought by
Ledesma Investments Llc
Purchase Details
Closed on
Dec 20, 2006
Sold by
Keeney Deborah C
Bought by
Ledesma Ernest
Home Financials for this Owner
Home Financials are based on the most recent Mortgage that was taken out on this home.
Original Mortgage
$106,250
Interest Rate
6.1%
Mortgage Type
New Conventional
Create a Home Valuation Report for This Property
The Home Valuation Report is an in-depth analysis detailing your home's value as well as a comparison with similar homes in the area
Home Values in the Area
Average Home Value in this Area
Purchase History
| Date | Buyer | Sale Price | Title Company |
|---|---|---|---|
| 206 Deer Road Llc | -- | -- | |
| Ledesma Ernest | -- | -- | |
| Ledesma Investments Llc | -- | -- | |
| Ledesma Ernest | $125,000 | -- |
Source: Public Records
Mortgage History
| Date | Status | Borrower | Loan Amount |
|---|---|---|---|
| Previous Owner | Ledesma Ernest | $90,000 | |
| Previous Owner | Ledesma Ernest | $106,250 |
Source: Public Records
Tax History
| Year | Tax Paid | Tax Assessment Tax Assessment Total Assessment is a certain percentage of the fair market value that is determined by local assessors to be the total taxable value of land and additions on the property. | Land | Improvement |
|---|---|---|---|---|
| 2025 | $3,012 | $81,667 | $22,800 | $58,867 |
| 2024 | $2,499 | $71,841 | $22,800 | $49,041 |
| 2023 | $1,981 | $54,106 | $17,600 | $36,506 |
| 2022 | $110 | $51,706 | $15,200 | $36,506 |
| 2021 | $1,688 | $45,252 | $14,000 | $31,252 |
| 2020 | $1,634 | $45,960 | $12,000 | $33,960 |
| 2019 | $1,491 | $42,483 | $10,000 | $32,483 |
| 2018 | $1,278 | $35,963 | $8,800 | $27,163 |
| 2017 | $1,373 | $38,679 | $8,800 | $29,879 |
| 2016 | $1,109 | $31,364 | $4,400 | $26,964 |
| 2015 | -- | $30,964 | $4,000 | $26,964 |
| 2014 | -- | $30,964 | $4,000 | $26,964 |
| 2013 | -- | $35,764 | $8,800 | $26,964 |
Source: Public Records
Map
Nearby Homes
- 216 Deer Rd
- 213 Doe Cir
- 202 Stag Rd
- 210 Stag Rd
- 107 Mary St
- 404 S Maple St
- 0 S Laurel St Unit 314048
- 301 S Ash St
- 3C Mccall Rd
- 0 Beebe Rd Unit 13221171
- 0 Zettler Rd
- 114 Rose Dr
- 313 Hickory St
- 137 Rose Dr
- 0 Hwy 21 N Unit 329376
- 0 Highway 21 N Unit SA349590
- 0 Georgia 21 Unit C
- 0 Georgia 21 Unit B
- 0 Hwy 21 N Unit SA342214
- 0 Georgia 119 Unit 317227
Your Personal Tour Guide
Ask me questions while you tour the home.