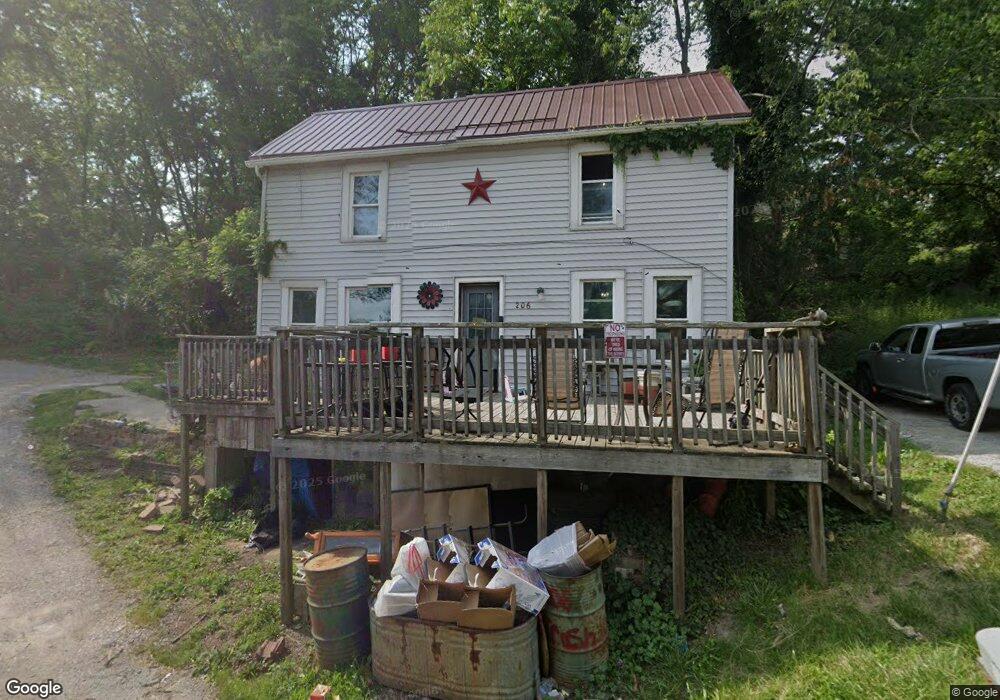
206 Depot St Flushing, OH 43977
Estimated Value: $76,000 - $263,000
4
Beds
1
Bath
1,380
Sq Ft
$92/Sq Ft
Est. Value
About This Home
This home is located at 206 Depot St, Flushing, OH 43977 and is currently estimated at $126,273, approximately $91 per square foot. 206 Depot St is a home located in Belmont County with nearby schools including Union Local Elementary School, Union Local Middle School, and Union Local High School.
Ownership History
Date
Name
Owned For
Owner Type
Purchase Details
Closed on
Jul 26, 2019
Sold by
Reline Wendy and Reline David
Bought by
Thompson Devin Michael
Current Estimated Value
Purchase Details
Closed on
Jun 4, 2012
Sold by
Mickey Samantha
Bought by
Reline Wendy and Reline David
Purchase Details
Closed on
May 18, 2012
Sold by
Vandine Stephanie and Valdine Ronald
Bought by
Mickey Samantha
Purchase Details
Closed on
Jan 24, 2001
Sold by
Mickey Bryan and Mickey Stephanie
Bought by
Mickey Bryan and Surv Stephanie L
Purchase Details
Closed on
May 15, 2000
Bought by
Norwest Bank Minnesota Na
Purchase Details
Closed on
Nov 1, 1995
Sold by
Jasmin Ernest T and Jasmin Bonita
Bought by
Jasmin Ernest T and Jasmin Bonita
Purchase Details
Closed on
Oct 18, 1995
Sold by
Eberhart Josephine
Bought by
Eberhart Josephine
Purchase Details
Closed on
Jan 1, 1986
Sold by
Eberhart Clarence and Eberhart Josep
Bought by
Eberhart Clarence and Eberhart Josep
Create a Home Valuation Report for This Property
The Home Valuation Report is an in-depth analysis detailing your home's value as well as a comparison with similar homes in the area
Purchase History
| Date | Buyer | Sale Price | Title Company |
|---|---|---|---|
| Thompson Devin Michael | -- | None Available | |
| Reline Wendy | $5,000 | Attorney | |
| Mickey Samantha | -- | Attorney | |
| Mickey Bryan | $3,500 | -- | |
| Norwest Bank Minnesota Na | $10,000 | -- | |
| Jasmin Ernest T | $6,000 | -- | |
| Eberhart Josephine | -- | -- | |
| Eberhart Clarence | -- | -- |
Source: Public Records
Tax History
| Year | Tax Paid | Tax Assessment Tax Assessment Total Assessment is a certain percentage of the fair market value that is determined by local assessors to be the total taxable value of land and additions on the property. | Land | Improvement |
|---|---|---|---|---|
| 2025 | $892 | $22,930 | $1,090 | $21,840 |
| 2024 | $879 | $22,930 | $1,090 | $21,840 |
| 2023 | $600 | $14,580 | $1,100 | $13,480 |
| 2022 | $600 | $14,578 | $1,096 | $13,482 |
| 2021 | $598 | $14,578 | $1,096 | $13,482 |
| 2020 | $554 | $12,680 | $950 | $11,730 |
| 2019 | $571 | $12,680 | $950 | $11,730 |
| 2018 | $546 | $12,680 | $950 | $11,730 |
| 2017 | $560 | $13,490 | $1,320 | $12,170 |
| 2016 | $565 | $13,490 | $1,320 | $12,170 |
| 2015 | $608 | $13,490 | $1,320 | $12,170 |
| 2014 | $529 | $12,070 | $1,200 | $10,870 |
| 2013 | $549 | $12,070 | $1,200 | $10,870 |
Source: Public Records
Map
Nearby Homes
- 117 A&B High St
- 0 Pearl St
- 203 Morristown Flushing Rd
- 41152 Black Oak Rd
- 0 Holloway Rd State Rt 331 Unit 5067951
- 72018 Uniontown Flushing Rd
- 409 Ashton St
- 77900 Slater Rd
- 38400 Cadiz-Piedmont Rd
- 70799 Bannock Uniontown Rd
- 73310 Hazelwood Hills Rd
- INLOT 19 Havenwood
- 34683 Sunshine Rd
- 67380 National New Lafferty Rd
- 34810 Nelson Dr
- 67290 National New Lafferty Rd
- 19 acres Saffell Rd
- 15 acres Saffell Rd
- 35 acres Saffell Rd
- 34561 Sunshine Rd
Your Personal Tour Guide
Ask me questions while you tour the home.