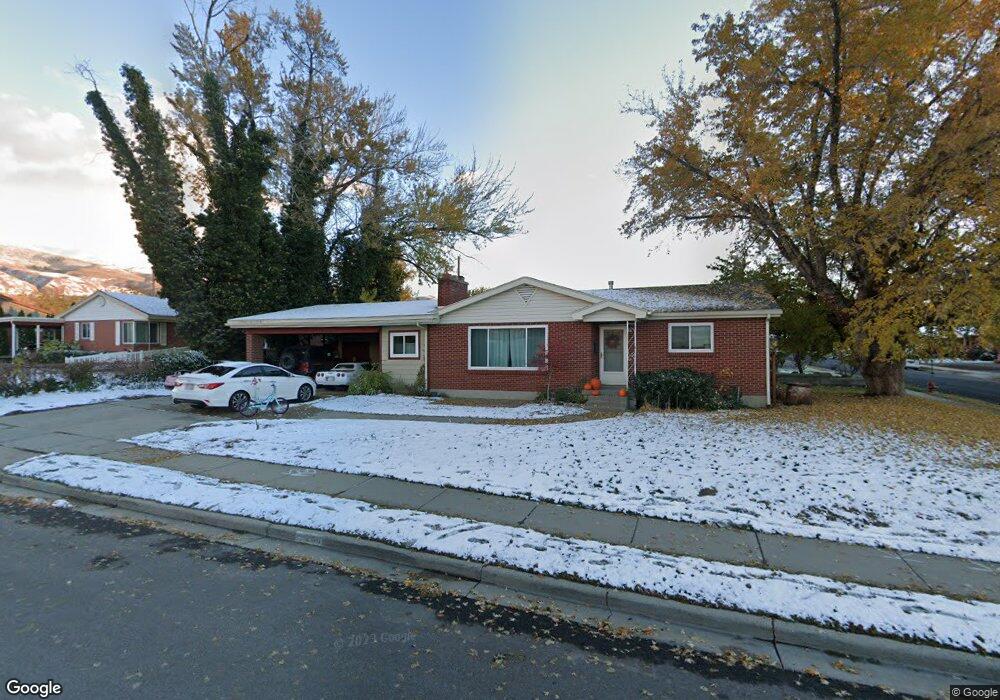
206 E 1050 N Bountiful, UT 84010
Estimated Value: $524,000 - $624,000
5
Beds
3
Baths
3,072
Sq Ft
$187/Sq Ft
Est. Value
About This Home
This home is located at 206 E 1050 N, Bountiful, UT 84010 and is currently estimated at $574,794, approximately $187 per square foot. 206 E 1050 N is a home located in Davis County with nearby schools including Tolman School, Bountiful Junior High School, and Viewmont High School.
Ownership History
Date
Name
Owned For
Owner Type
Purchase Details
Closed on
Jul 10, 2018
Sold by
Sperry Rebecca B
Bought by
Cook Ryan P
Current Estimated Value
Home Financials for this Owner
Home Financials are based on the most recent Mortgage that was taken out on this home.
Original Mortgage
$274,725
Outstanding Balance
$243,242
Interest Rate
5.62%
Mortgage Type
FHA
Estimated Equity
$331,552
Purchase Details
Closed on
Jun 19, 2009
Sold by
Sperry Rebecca B
Bought by
Sperry Rebecca B and Rebecca B Sperry Trust
Create a Home Valuation Report for This Property
The Home Valuation Report is an in-depth analysis detailing your home's value as well as a comparison with similar homes in the area
Purchase History
| Date | Buyer | Sale Price | Title Company |
|---|---|---|---|
| Cook Ryan P | -- | Backman Title | |
| Sperry Rebecca B | -- | None Available |
Source: Public Records
Mortgage History
| Date | Status | Borrower | Loan Amount |
|---|---|---|---|
| Open | Cook Ryan P | $274,725 |
Source: Public Records
Tax History
| Year | Tax Paid | Tax Assessment Tax Assessment Total Assessment is a certain percentage of the fair market value that is determined by local assessors to be the total taxable value of land and additions on the property. | Land | Improvement |
|---|---|---|---|---|
| 2025 | $3,655 | $302,500 | $118,153 | $184,347 |
| 2024 | $3,344 | $292,600 | $103,424 | $189,176 |
| 2023 | $3,220 | $509,000 | $192,306 | $316,694 |
| 2022 | $3,243 | $299,200 | $105,559 | $193,641 |
| 2021 | $3,004 | $425,000 | $138,062 | $286,938 |
| 2020 | $2,827 | $376,000 | $118,582 | $257,418 |
| 2019 | $2,497 | $343,000 | $129,723 | $213,277 |
| 2018 | $2,109 | $294,000 | $127,264 | $166,736 |
| 2016 | $1,690 | $126,885 | $51,192 | $75,693 |
| 2015 | $1,676 | $118,910 | $51,192 | $67,718 |
| 2014 | $1,659 | $121,129 | $51,192 | $69,937 |
| 2013 | -- | $116,195 | $39,786 | $76,409 |
Source: Public Records
Map
Nearby Homes
- 1420 N Main St
- 106 W 700 N
- 453 N 400 E Unit 7-D
- 184 Park Shadows Cir
- 1130 N 200 W
- 967 S Courtyard Ln
- 345 N 400 E
- 235 W 1400 N
- 96 Village Square Rd
- 49 E 200 N Unit 4
- 41 E 200 N Unit 6
- 252 N Main St
- 256 N Main St
- 254 N Main St
- 563 N 200 W
- 662 E 1200 N
- 951 Centerville Commons Way
- 55 E 200 N Unit 2
- 51 E 200 N Unit 3
- 499 N 200 W Unit 30
Your Personal Tour Guide
Ask me questions while you tour the home.