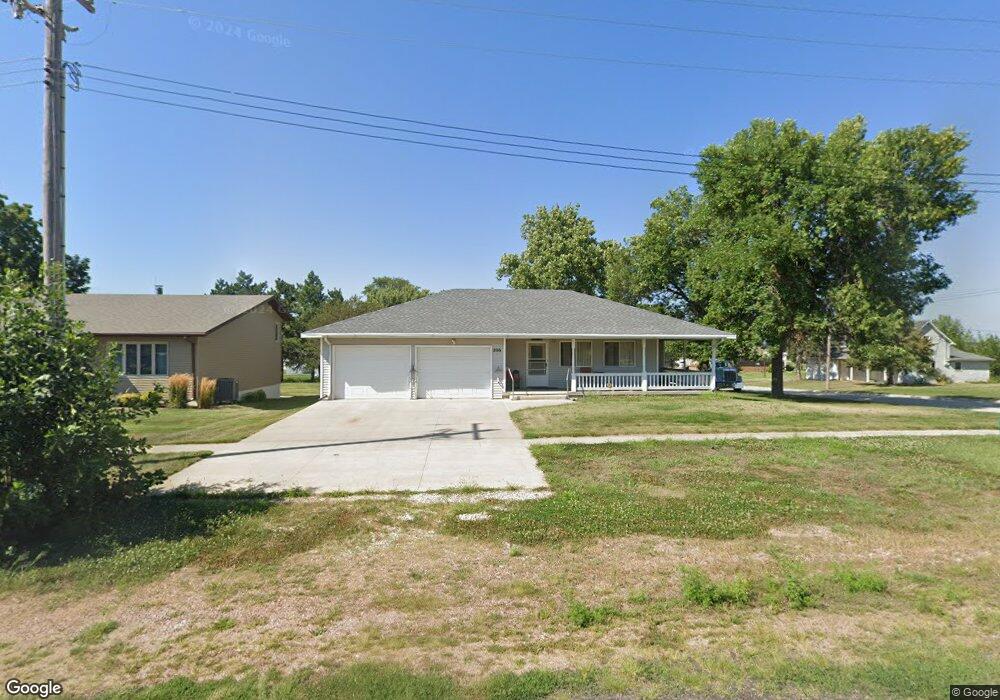
206 E 3rd St Osmond, NE 68765
Estimated Value: $201,000 - $256,000
2
Beds
2
Baths
2,118
Sq Ft
$106/Sq Ft
Est. Value
About This Home
This home is located at 206 E 3rd St, Osmond, NE 68765 and is currently estimated at $223,967, approximately $105 per square foot. 206 E 3rd St is a home located in Pierce County with nearby schools including Osmond Elementary School, Osmond High School, and St Mary's School.
Ownership History
Date
Name
Owned For
Owner Type
Purchase Details
Closed on
Feb 3, 2025
Sold by
Mattinni Jane F and Mattini Jane F
Bought by
Jane F Mattini Trust and Mattini
Current Estimated Value
Purchase Details
Closed on
Sep 29, 2015
Sold by
Nielsen Elaine L and Nielsen Erik A
Bought by
Mattini Jane F and Mattini Robert S
Purchase Details
Closed on
Aug 19, 2015
Sold by
Kenny Mary Jean and Kenny Stephen
Bought by
Mattini Jane F and Mattini Robert S
Purchase Details
Closed on
Aug 17, 2015
Sold by
Kaster Kathleen M and Kaster Randall J
Bought by
Mattini Jane F and Mattini Robert S
Purchase Details
Closed on
Aug 15, 2015
Sold by
True Patricia A and True Grant
Bought by
Mattini Jane F and Mattini Robert S
Purchase Details
Closed on
Aug 14, 2015
Sold by
Kester Teresa A and Kester Richard C
Bought by
Mattini Jane F and Mattini Robert S
Purchase Details
Closed on
Aug 7, 2015
Sold by
Paul Geraldine M and Paul Kenneth R
Bought by
Mattini Jane F and Mattini Robert S
Create a Home Valuation Report for This Property
The Home Valuation Report is an in-depth analysis detailing your home's value as well as a comparison with similar homes in the area
Purchase History
| Date | Buyer | Sale Price | Title Company |
|---|---|---|---|
| Jane F Mattini Trust | -- | None Listed On Document | |
| Mattini Jane F | $15,000 | None Available | |
| Mattini Jane F | $15,000 | None Available | |
| Mattini Jane F | $15,000 | None Available | |
| Mattini Jane F | -- | None Available | |
| Mattini Jane F | $37,200 | None Available | |
| Mattini Jane F | $15,000 | None Available |
Source: Public Records
Tax History
| Year | Tax Paid | Tax Assessment Tax Assessment Total Assessment is a certain percentage of the fair market value that is determined by local assessors to be the total taxable value of land and additions on the property. | Land | Improvement |
|---|---|---|---|---|
| 2025 | $3,068 | $239,835 | $14,065 | $225,770 |
| 2024 | $3,046 | $239,835 | $14,065 | $225,770 |
| 2023 | $3,933 | $231,395 | $5,625 | $225,770 |
| 2022 | $3,555 | $193,765 | $5,625 | $188,140 |
| 2021 | $3,313 | $179,830 | $5,625 | $174,205 |
| 2020 | $3,112 | $168,525 | $5,625 | $162,900 |
| 2019 | $2,945 | $168,525 | $5,625 | $162,900 |
| 2018 | $2,863 | $168,525 | $5,625 | $162,900 |
| 2017 | $2,727 | $160,770 | $5,625 | $155,145 |
| 2016 | $2,625 | $160,770 | $5,625 | $155,145 |
| 2015 | $2,663 | $163,275 | $5,625 | $157,650 |
| 2014 | $2,452 | $137,000 | $5,625 | $131,375 |
Source: Public Records
Map
Nearby Homes
- 301 N Logan St
- 610 N Maple St
- 304 W 2nd St
- 708 N Maple St
- 540th Ave 866 Rd
- 108 W 14th St
- 542 Nebraska 13
- 55390 Hwy 20
- 0000 856th Rd
- 85012 545th Ave
- TBD 4th St
- 200 E Roosevelt St
- 502 S Sherman St
- 708 E Grant St
- 702 E Norris St
- 703 E Clark St
- 549th Ave Hwy 13
- 108 N Plum St
- 85162 Starkel Rd
- 85170 Starkel Rd
Your Personal Tour Guide
Ask me questions while you tour the home.