206 Ferguson St Warner Robins, GA 31093
Estimated Value: $85,558 - $152,000
--
Bed
1
Bath
1,296
Sq Ft
$93/Sq Ft
Est. Value
About This Home
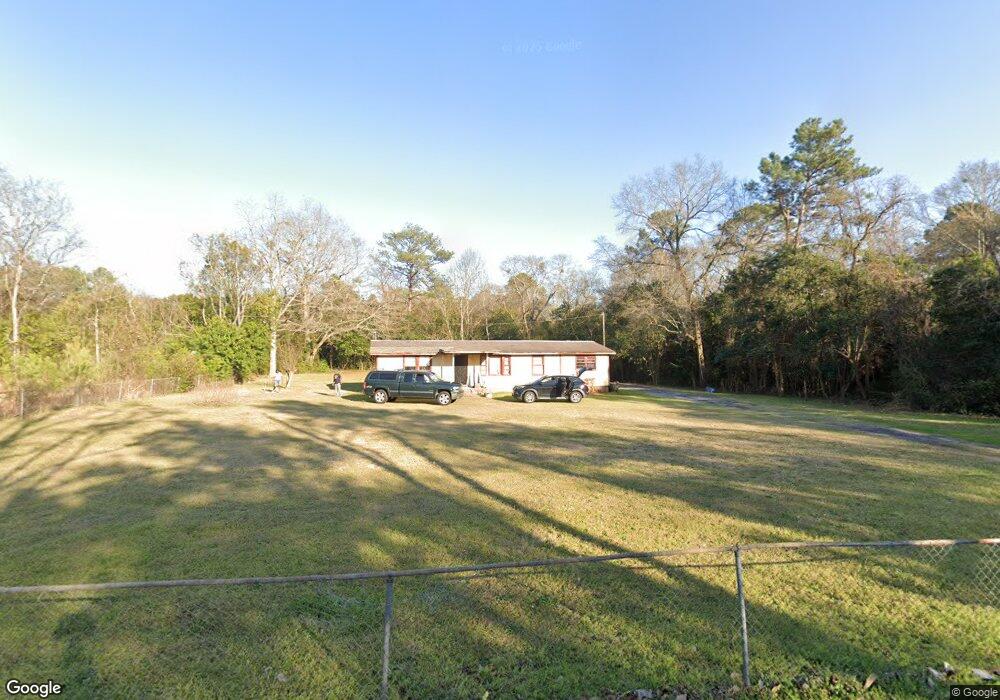
This home is located at 206 Ferguson St, Warner Robins, GA 31093 and is currently estimated at $121,140, approximately $93 per square foot. 206 Ferguson St is a home located in Houston County with nearby schools including Northside Elementary School, Huntington Middle School, and Warner Robins High School.
Ownership History
Date
Name
Owned For
Owner Type
Purchase Details
Closed on
Jul 15, 2024
Sold by
206 Ferguson Street Revocable Living Tru and Finney John E
Bought by
206 Ferguson Street Revocable Living Trust and Finney
Current Estimated Value
Purchase Details
Closed on
Aug 1, 1994
Sold by
Lowe R Wayne
Bought by
Finney John E
Purchase Details
Closed on
Oct 5, 1982
Sold by
Jackson Alton
Bought by
Lowe R Wayne
Purchase Details
Closed on
Oct 14, 1977
Sold by
Fbs Homes Inc
Bought by
Jackson Alton
Purchase Details
Closed on
Apr 5, 1977
Sold by
Jackson Alton
Bought by
Inestors Diversified Services
Purchase Details
Closed on
Jan 3, 1975
Sold by
Fbs Homes Inc
Bought by
Jackson Alton
Purchase Details
Closed on
Nov 5, 1974
Sold by
Jackson Alton
Bought by
Fbs Homes Inc
Purchase Details
Closed on
Aug 22, 1968
Bought by
Jackson Alton
Create a Home Valuation Report for This Property
The Home Valuation Report is an in-depth analysis detailing your home's value as well as a comparison with similar homes in the area
Home Values in the Area
Average Home Value in this Area
Purchase History
| Date | Buyer | Sale Price | Title Company |
|---|---|---|---|
| 206 Ferguson Street Revocable Living Trust | -- | None Listed On Document | |
| 206 Ferguson Street Revocable Living Trust | -- | None Listed On Document | |
| Finney John E | -- | -- | |
| Lowe R Wayne | -- | -- | |
| Jackson Alton | -- | -- | |
| Fbs Homes Inc | -- | -- | |
| Inestors Diversified Services | -- | -- | |
| Jackson Alton | -- | -- | |
| Fbs Homes Inc | -- | -- | |
| Jackson Alton | -- | -- |
Source: Public Records
Tax History Compared to Growth
Tax History
| Year | Tax Paid | Tax Assessment Tax Assessment Total Assessment is a certain percentage of the fair market value that is determined by local assessors to be the total taxable value of land and additions on the property. | Land | Improvement |
|---|---|---|---|---|
| 2024 | $387 | $16,160 | $3,000 | $13,160 |
| 2023 | $312 | $12,920 | $2,080 | $10,840 |
| 2022 | $320 | $13,240 | $2,080 | $11,160 |
| 2021 | $328 | $13,480 | $4,080 | $9,400 |
| 2020 | $355 | $14,560 | $4,080 | $10,480 |
| 2019 | $355 | $14,560 | $4,080 | $10,480 |
| 2018 | $355 | $14,560 | $4,080 | $10,480 |
| 2017 | $356 | $14,560 | $4,080 | $10,480 |
| 2016 | $336 | $13,720 | $3,240 | $10,480 |
| 2015 | $336 | $13,720 | $3,240 | $10,480 |
| 2014 | -- | $13,720 | $3,240 | $10,480 |
| 2013 | -- | $13,720 | $3,240 | $10,480 |
Source: Public Records
Map
Nearby Homes