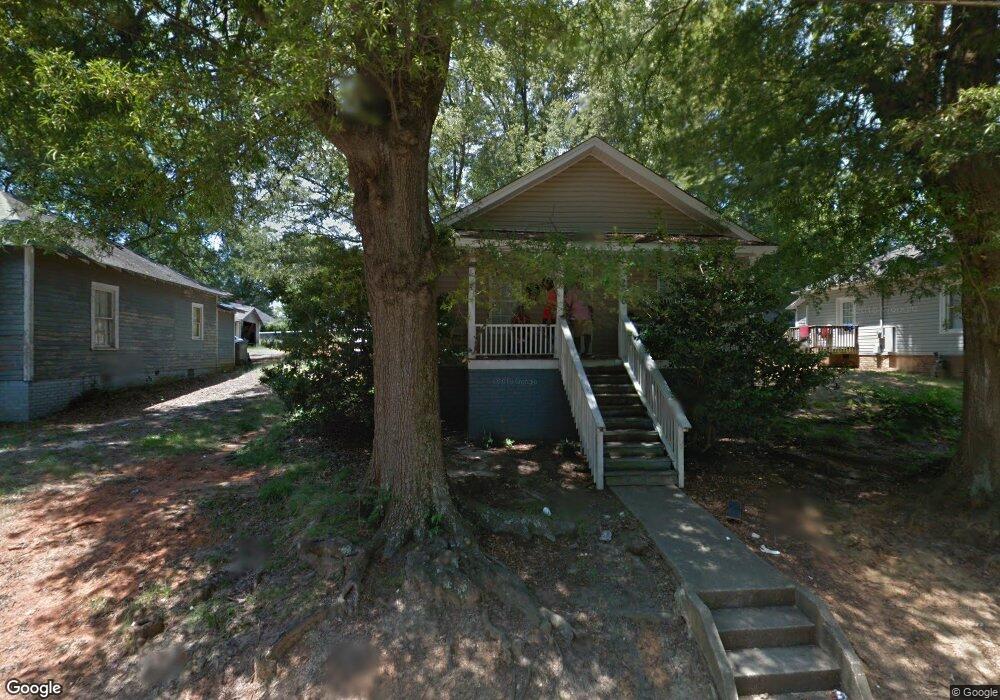
206 Flowe Ave Kannapolis, NC 28083
Estimated Value: $186,000 - $235,000
3
Beds
1
Bath
1,080
Sq Ft
$198/Sq Ft
Est. Value
About This Home
This home is located at 206 Flowe Ave, Kannapolis, NC 28083 and is currently estimated at $213,617, approximately $197 per square foot. 206 Flowe Ave is a home located in Cabarrus County with nearby schools including North Kannapolis Elementary School, Kannapolis Middle, and A.L. Brown High School.
Ownership History
Date
Name
Owned For
Owner Type
Purchase Details
Closed on
Dec 1, 2013
Sold by
Three Mile Creek Llc
Bought by
Journey Investment Group Llc
Current Estimated Value
Purchase Details
Closed on
Sep 17, 2009
Sold by
Drye Development Llc
Bought by
Three Mile Creek Llc
Home Financials for this Owner
Home Financials are based on the most recent Mortgage that was taken out on this home.
Original Mortgage
$140,000
Interest Rate
5.15%
Mortgage Type
Future Advance Clause Open End Mortgage
Purchase Details
Closed on
Jan 24, 2006
Sold by
Newton Donald L and Newton Sarah S
Bought by
Wimmer Kyle and Wimmer Tracy R
Home Financials for this Owner
Home Financials are based on the most recent Mortgage that was taken out on this home.
Original Mortgage
$53,960
Interest Rate
6.22%
Mortgage Type
Purchase Money Mortgage
Purchase Details
Closed on
Aug 14, 1998
Sold by
Gilliam Everette L and Gilliam Judy Y
Bought by
Gilliam Family Ltd Partnership
Purchase Details
Closed on
Jan 1, 1986
Create a Home Valuation Report for This Property
The Home Valuation Report is an in-depth analysis detailing your home's value as well as a comparison with similar homes in the area
Home Values in the Area
Average Home Value in this Area
Purchase History
| Date | Buyer | Sale Price | Title Company |
|---|---|---|---|
| Journey Investment Group Llc | $106,000 | -- | |
| Three Mile Creek Llc | -- | None Available | |
| Wimmer Kyle | $38,000 | None Available | |
| Gilliam Family Ltd Partnership | -- | -- | |
| -- | $14,000 | -- |
Source: Public Records
Mortgage History
| Date | Status | Borrower | Loan Amount |
|---|---|---|---|
| Previous Owner | Three Mile Creek Llc | $140,000 | |
| Previous Owner | Wimmer Kyle | $53,960 |
Source: Public Records
Tax History
| Year | Tax Paid | Tax Assessment Tax Assessment Total Assessment is a certain percentage of the fair market value that is determined by local assessors to be the total taxable value of land and additions on the property. | Land | Improvement |
|---|---|---|---|---|
| 2025 | $2,098 | $184,800 | $48,000 | $136,800 |
| 2024 | $2,098 | $184,800 | $48,000 | $136,800 |
| 2023 | $1,430 | $104,350 | $30,000 | $74,350 |
| 2022 | $1,430 | $104,350 | $30,000 | $74,350 |
| 2021 | $1,430 | $104,350 | $30,000 | $74,350 |
| 2020 | $1,430 | $104,350 | $30,000 | $74,350 |
| 2019 | $992 | $72,430 | $13,600 | $58,830 |
| 2018 | $978 | $72,430 | $13,600 | $58,830 |
| 2017 | $963 | $72,430 | $13,600 | $58,830 |
| 2016 | $963 | $78,910 | $22,400 | $56,510 |
| 2015 | $922 | $78,910 | $22,400 | $56,510 |
| 2014 | $922 | $78,910 | $22,400 | $56,510 |
Source: Public Records
Map
Nearby Homes
- 502 Milton L Taylor St
- 600 Foster St
- 351 Center St
- 306 York Ave
- 609 Huron St
- 401 York Ave
- 535 Martin Luther King Junior Ave
- 207 S East Ave
- 541 Martin Luther King Junior Ave
- 315 S Rose Ave
- 208 James St
- 202 Milton L Taylor St
- 661 Wilson St
- 705 Gem St
- 704 Gem St Unit 17
- 143 Johndy Ave
- 410 S East Ave
- 200 Martin Luther King Junior Ave
- 5941 Mantle Way
- 0 Buick Ave
Your Personal Tour Guide
Ask me questions while you tour the home.