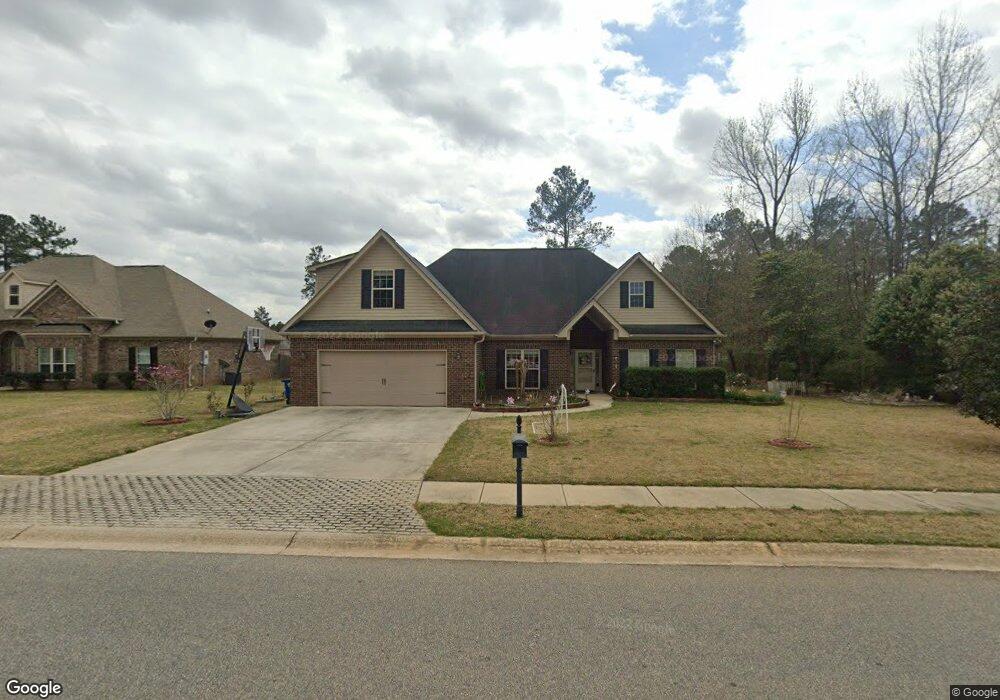
206 Golden Ocala Blvd Macon, GA 31216
Estimated Value: $292,519 - $401,000
4
Beds
3
Baths
2,593
Sq Ft
$135/Sq Ft
Est. Value
About This Home
This home is located at 206 Golden Ocala Blvd, Macon, GA 31216 and is currently estimated at $349,130, approximately $134 per square foot. 206 Golden Ocala Blvd is a home located in Bibb County with nearby schools including Heard Elementary School, Rutland Middle School, and Rutland High School.
Ownership History
Date
Name
Owned For
Owner Type
Purchase Details
Closed on
May 8, 2018
Sold by
Nguyen Chue T
Bought by
Nguyen Chue T and Le Ngan Kim
Current Estimated Value
Home Financials for this Owner
Home Financials are based on the most recent Mortgage that was taken out on this home.
Original Mortgage
$153,000
Outstanding Balance
$131,294
Interest Rate
4.44%
Mortgage Type
New Conventional
Estimated Equity
$217,836
Purchase Details
Closed on
Dec 11, 2009
Sold by
Carreker Construction Inc
Bought by
Lewandowski Ann
Home Financials for this Owner
Home Financials are based on the most recent Mortgage that was taken out on this home.
Original Mortgage
$153,750
Interest Rate
5.03%
Mortgage Type
Unknown
Purchase Details
Closed on
Oct 23, 2009
Sold by
Carreker Development Inc
Bought by
Carreker Construction Inc
Home Financials for this Owner
Home Financials are based on the most recent Mortgage that was taken out on this home.
Original Mortgage
$153,750
Interest Rate
5.03%
Mortgage Type
Unknown
Create a Home Valuation Report for This Property
The Home Valuation Report is an in-depth analysis detailing your home's value as well as a comparison with similar homes in the area
Home Values in the Area
Average Home Value in this Area
Purchase History
| Date | Buyer | Sale Price | Title Company |
|---|---|---|---|
| Nguyen Chue T | -- | None Available | |
| Nguyen Chuc T | $213,000 | None Available | |
| Lewandowski Ann | $192,667 | None Available | |
| Carreker Construction Inc | $40,000 | None Available |
Source: Public Records
Mortgage History
| Date | Status | Borrower | Loan Amount |
|---|---|---|---|
| Open | Nguyen Chuc T | $153,000 | |
| Previous Owner | Carreker Construction Inc | $153,750 |
Source: Public Records
Tax History Compared to Growth
Tax History
| Year | Tax Paid | Tax Assessment Tax Assessment Total Assessment is a certain percentage of the fair market value that is determined by local assessors to be the total taxable value of land and additions on the property. | Land | Improvement |
|---|---|---|---|---|
| 2025 | $1,967 | $87,042 | $10,000 | $77,042 |
| 2024 | $2,033 | $87,042 | $10,000 | $77,042 |
| 2023 | $2,371 | $87,042 | $10,000 | $77,042 |
| 2022 | $3,218 | $99,946 | $12,000 | $87,946 |
| 2021 | $3,014 | $86,317 | $11,400 | $74,917 |
| 2020 | $2,763 | $78,174 | $11,400 | $66,774 |
| 2019 | $2,782 | $78,058 | $11,400 | $66,658 |
| 2018 | $4,859 | $78,058 | $11,400 | $66,658 |
| 2017 | $2,711 | $72,368 | $11,400 | $60,968 |
| 2016 | $2,504 | $72,368 | $11,400 | $60,968 |
| 2015 | $3,544 | $72,368 | $11,400 | $60,968 |
| 2014 | $1,107 | $67,703 | $10,800 | $56,903 |
Source: Public Records
Map
Nearby Homes
- 326 Thoroughbred Ln
- 405 Stonecrest Ct
- 813 Ocala National Trail
- 361 Thoroughbred Ln
- 3676 Jones Rd
- 3720 Dean Dr
- 0 Houston Rd Unit 10572705
- 328 Cody Dr
- 318 Cody Dr
- 330 Cody Dr
- 310 Cody Dr
- 1062 Alma Dr
- Jodeco Plan at Goodall Woods
- Sierra Plan at Goodall Woods
- Poplar Plan at Goodall Woods
- Russell Plan at Goodall Woods
- Clayton Plan at Goodall Woods
- 108 Alayna Ct
- 198 Golden Ocala Blvd
- 222 Golden Ocala Blvd
- 182 Golden Ocala Blvd
- 512 Silver Springs Ct
- 207 Golden Ocala Blvd
- 508 Silver Springs Ct
- 508 Silver Springs Coury
- 230 Golden Ocala Blvd
- 199 Golden Ocala Blvd
- 215 Golden Ocala Blvd
- 178 Golden Ocala Blvd
- 223 Golden Ocala Blvd
- 183 Golden Ocala Blvd
- 517 Silver Springs Ct
- 504 Silver Springs Ct
- 214 Golden Ocala Blvd
- 0 Golden Ocala Blvd Unit 7331098
- 0 Golden Ocala Blvd Unit 7287851
- 0 Golden Ocala Blvd Unit 7272193
- 0 Golden Ocala Blvd Unit 7218801