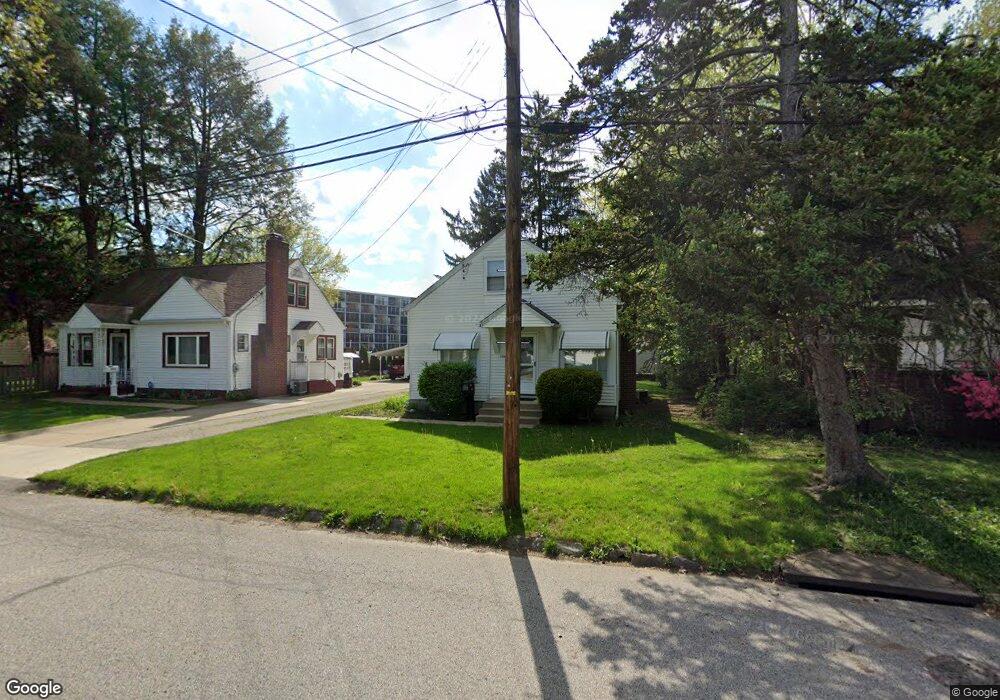
206 Highpoint Ave Akron, OH 44312
Ellet NeighborhoodEstimated Value: $126,000 - $154,738
4
Beds
2
Baths
1,026
Sq Ft
$142/Sq Ft
Est. Value
About This Home
This home is located at 206 Highpoint Ave, Akron, OH 44312 and is currently estimated at $145,435, approximately $141 per square foot. 206 Highpoint Ave is a home located in Summit County with nearby schools including Ellet High School, Summit Academy Akron Elementary School, and Akron Preparatory school.
Ownership History
Date
Name
Owned For
Owner Type
Purchase Details
Closed on
Dec 12, 2024
Sold by
Williams Jennifer L and Winning Jennifer L
Bought by
K Williams Investment Properties Llc
Current Estimated Value
Purchase Details
Closed on
Oct 18, 2004
Sold by
Floyd James M and Floyd Mary V
Bought by
Williams Jennifer L
Home Financials for this Owner
Home Financials are based on the most recent Mortgage that was taken out on this home.
Original Mortgage
$65,000
Interest Rate
5.89%
Mortgage Type
Purchase Money Mortgage
Purchase Details
Closed on
Oct 5, 2004
Sold by
Floyd James M and Floyd Mary V
Bought by
Floyd James M
Home Financials for this Owner
Home Financials are based on the most recent Mortgage that was taken out on this home.
Original Mortgage
$65,000
Interest Rate
5.89%
Mortgage Type
Purchase Money Mortgage
Purchase Details
Closed on
Aug 1, 2003
Sold by
Floyd James M and Floyd Mary V
Bought by
Floyd James M and Floyd Mary
Create a Home Valuation Report for This Property
The Home Valuation Report is an in-depth analysis detailing your home's value as well as a comparison with similar homes in the area
Home Values in the Area
Average Home Value in this Area
Purchase History
| Date | Buyer | Sale Price | Title Company |
|---|---|---|---|
| K Williams Investment Properties Llc | $120,000 | None Listed On Document | |
| Williams Jennifer L | $65,000 | First Security Title Corpora | |
| Floyd James M | -- | -- | |
| Floyd James M | -- | -- |
Source: Public Records
Mortgage History
| Date | Status | Borrower | Loan Amount |
|---|---|---|---|
| Previous Owner | Williams Jennifer L | $65,000 |
Source: Public Records
Tax History
| Year | Tax Paid | Tax Assessment Tax Assessment Total Assessment is a certain percentage of the fair market value that is determined by local assessors to be the total taxable value of land and additions on the property. | Land | Improvement |
|---|---|---|---|---|
| 2025 | $2,437 | $46,057 | $8,540 | $37,517 |
| 2024 | $2,437 | $46,057 | $8,540 | $37,517 |
| 2023 | $2,437 | $46,057 | $8,540 | $37,517 |
| 2022 | $2,370 | $35,190 | $6,472 | $28,718 |
| 2021 | $2,468 | $35,190 | $6,472 | $28,718 |
| 2020 | $2,432 | $35,190 | $6,470 | $28,720 |
| 2019 | $2,219 | $28,950 | $5,890 | $23,060 |
| 2018 | $2,190 | $28,950 | $5,890 | $23,060 |
| 2017 | $1,935 | $28,950 | $5,890 | $23,060 |
| 2016 | $1,936 | $26,210 | $5,890 | $20,320 |
| 2015 | $1,935 | $26,210 | $5,890 | $20,320 |
| 2014 | $1,919 | $26,210 | $5,890 | $20,320 |
| 2013 | $2,026 | $28,340 | $5,890 | $22,450 |
Source: Public Records
Map
Nearby Homes
- 2331 E Market St
- 187 Highpoint Ave
- 228 Hawk Ave
- 110 Eastholm Ave
- 260 Prairie Dr
- 2269 Emerald Dr
- 2382 Mogadore Rd
- 2258 Mogadore Rd
- 26 Ansel Ave
- 37 Ansel Ave
- 42 Woolf Ave
- 20 Verdun Dr
- 111 Akers Ave
- 147 Woolf Ave
- 114 Davenport Ave
- 2541 Edgebrook Ave
- 2138 Forest Oak Dr
- 2199 Kelty Ct Unit 29
- 210 Davenport Ave
- 487 Hilbish Ave
- 202 Highpoint Ave
- 212 Highpoint Ave
- 222 Highpoint Ave
- 190 Highpoint Ave
- 205 Highpoint Ave
- 205 Highpoint Ave
- 201 Highpoint Ave
- 213 Highpoint Ave
- 199 Highpoint Ave
- 226 Highpoint Ave
- 193 Highpoint Ave
- 2324 Jack Ave Unit 2324
- 2322 Jack Ave
- 2326 Jack Ave Unit 2326
- 225 Highpoint Ave
- 2331 E Market Street 313 St Unit 604
- 232 Highpoint Ave
- 230 Highpoint Ave
- 180 Highpoint Ave
- 2304 Jack Ave
Your Personal Tour Guide
Ask me questions while you tour the home.