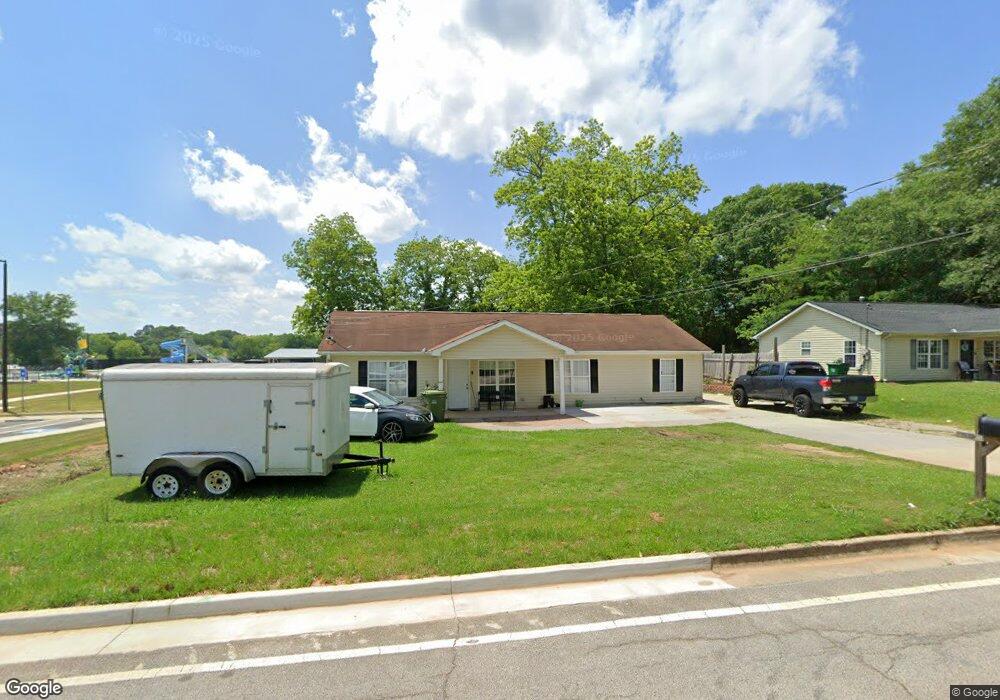
206 King St Carrollton, GA 30117
Estimated Value: $225,000 - $281,000
4
Beds
2
Baths
1,512
Sq Ft
$165/Sq Ft
Est. Value
About This Home
This home is located at 206 King St, Carrollton, GA 30117 and is currently estimated at $249,067, approximately $164 per square foot. 206 King St is a home located in Carroll County with nearby schools including Carrollton Elementary School, Carrollton Upper Elementary School, and Carrollton Middle School.
Ownership History
Date
Name
Owned For
Owner Type
Purchase Details
Closed on
Apr 9, 2018
Sold by
Mcgowan Co Llc
Bought by
Cuenca Tomas
Current Estimated Value
Home Financials for this Owner
Home Financials are based on the most recent Mortgage that was taken out on this home.
Original Mortgage
$105,051
Outstanding Balance
$90,384
Interest Rate
4.46%
Mortgage Type
New Conventional
Estimated Equity
$158,683
Purchase Details
Closed on
Apr 30, 2007
Sold by
Mcgowan Steve D
Bought by
The Mcgowan Co
Purchase Details
Closed on
Feb 21, 2006
Sold by
Not Provided
Bought by
Mcgowan Company Llc
Purchase Details
Closed on
Dec 6, 2000
Sold by
Patterson Roger Etal
Bought by
Jmp Properties Llc
Purchase Details
Closed on
Jul 13, 2000
Sold by
Philpot Peggy
Bought by
Patterson Roger M and Peggy
Purchase Details
Closed on
Jul 6, 2000
Sold by
Wood Kenneth A
Bought by
Philpot Peggy
Purchase Details
Closed on
Dec 13, 1999
Sold by
Wood
Bought by
Wood Raymond Heirs
Purchase Details
Closed on
Dec 9, 1999
Sold by
Wood Raymond Heirs
Bought by
Wood Kenneth A
Create a Home Valuation Report for This Property
The Home Valuation Report is an in-depth analysis detailing your home's value as well as a comparison with similar homes in the area
Home Values in the Area
Average Home Value in this Area
Purchase History
| Date | Buyer | Sale Price | Title Company |
|---|---|---|---|
| Cuenca Tomas | $108,300 | -- | |
| The Mcgowan Co | -- | -- | |
| Mcgowan Company Llc | $383,000 | -- | |
| Jmp Properties Llc | -- | -- | |
| Patterson Roger M | -- | -- | |
| Philpot Peggy | $5,900 | -- | |
| Wood Raymond Heirs | -- | -- | |
| Wood Kenneth A | -- | -- |
Source: Public Records
Mortgage History
| Date | Status | Borrower | Loan Amount |
|---|---|---|---|
| Open | Cuenca Tomas | $105,051 |
Source: Public Records
Tax History Compared to Growth
Tax History
| Year | Tax Paid | Tax Assessment Tax Assessment Total Assessment is a certain percentage of the fair market value that is determined by local assessors to be the total taxable value of land and additions on the property. | Land | Improvement |
|---|---|---|---|---|
| 2024 | $2,251 | $82,366 | $7,669 | $74,697 |
| 2023 | $2,251 | $75,596 | $7,670 | $67,926 |
| 2022 | $1,739 | $59,588 | $5,126 | $54,462 |
| 2021 | $1,476 | $50,553 | $3,797 | $46,756 |
| 2020 | $1,313 | $44,950 | $3,797 | $41,153 |
| 2019 | $1,202 | $40,749 | $3,797 | $36,952 |
| 2018 | $1,039 | $34,735 | $3,797 | $30,938 |
| 2017 | $1,045 | $34,735 | $3,797 | $30,938 |
| 2016 | $1,051 | $34,735 | $3,797 | $30,938 |
| 2015 | $879 | $28,457 | $4,000 | $24,457 |
| 2014 | $883 | $28,457 | $4,000 | $24,457 |
Source: Public Records
Map
Nearby Homes
- TRACT1-7 Us Highway 27
- 405 N Park St
- 108 Springwood Dr
- 109 S Park St
- 205 Johnson Ave Unit 231
- 0 Ward St Unit 10390499
- 160 Watson St
- 110 Town Walk Ln
- 654 King St
- 301 C4 Bradley St
- 301 Bradley St
- 103 W Chandler St
- 27 South St
- 219 Broad St
- 109 7th St
- 250 Riversong Rd
- 250 Riversong Rd Unit 55
- 777 College St
- 149 River Dr
- 149 River Dr Unit 42
- 206 Martin Luther King jr St
- 210 Martin Luther King jr St
- 211 Martin Luther King jr St
- 214 King St
- 214 Martin Luther King Junior St
- 214 Martin Luther King jr St Unit 13
- 214 Martin Luther King jr St
- 201 Martin Luther King jr St
- 214 Lambert St
- 132 Martin Luther King jr St
- 210 Lambert St
- 305 Martin Luther King Junior St
- 127 Martin Luther King jr St
- 210 Gladys Hendrix Way
- 210 Gladys Hendrix Way
- 210 Gladys Hendrix Way
- 117 Martin Luther King jr St
- 302 Martin Luther King Junior St
- 204 N Park St
- 202 N Park St