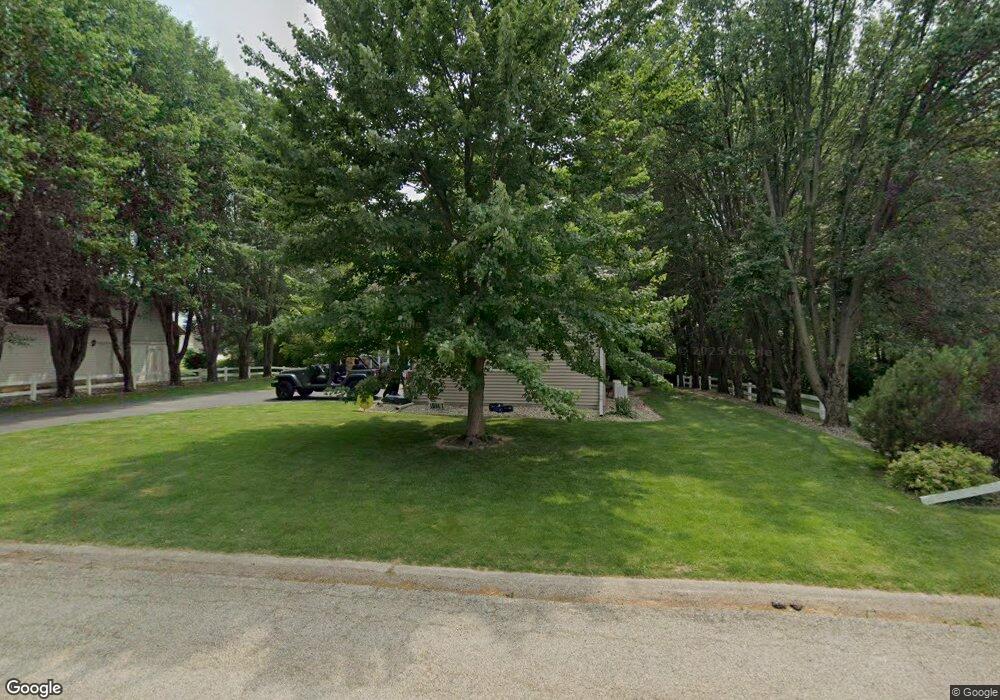
206 Lake View Ct Colona, IL 61241
Estimated Value: $250,000 - $294,000
3
Beds
3
Baths
2,081
Sq Ft
$129/Sq Ft
Est. Value
About This Home
This home is located at 206 Lake View Ct, Colona, IL 61241 and is currently estimated at $269,192, approximately $129 per square foot. 206 Lake View Ct is a home located in Henry County with nearby schools including Geneseo High School.
Ownership History
Date
Name
Owned For
Owner Type
Purchase Details
Closed on
Dec 31, 2024
Sold by
Bopes Eric S and Bopes Dawn R
Bought by
Cronau John Hovell
Current Estimated Value
Home Financials for this Owner
Home Financials are based on the most recent Mortgage that was taken out on this home.
Original Mortgage
$234,671
Outstanding Balance
$233,003
Interest Rate
6.69%
Mortgage Type
FHA
Estimated Equity
$36,189
Purchase Details
Closed on
Jan 4, 2020
Sold by
Bopes Eric S
Bought by
Bopes Eric S and Bopes Dawn R
Home Financials for this Owner
Home Financials are based on the most recent Mortgage that was taken out on this home.
Original Mortgage
$176,000
Interest Rate
2.87%
Mortgage Type
Closed End Mortgage
Purchase Details
Closed on
Nov 8, 2013
Sold by
Gilmore Simone S
Bought by
Bopes Eric S
Home Financials for this Owner
Home Financials are based on the most recent Mortgage that was taken out on this home.
Original Mortgage
$166,250
Interest Rate
4.25%
Mortgage Type
New Conventional
Create a Home Valuation Report for This Property
The Home Valuation Report is an in-depth analysis detailing your home's value as well as a comparison with similar homes in the area
Home Values in the Area
Average Home Value in this Area
Purchase History
| Date | Buyer | Sale Price | Title Company |
|---|---|---|---|
| Cronau John Hovell | $239,000 | None Listed On Document | |
| Bopes Eric S | -- | Lakeshore Title Agency | |
| Bopes Eric S | $175,000 | Gomez Title & Closing Co |
Source: Public Records
Mortgage History
| Date | Status | Borrower | Loan Amount |
|---|---|---|---|
| Open | Cronau John Hovell | $234,671 | |
| Previous Owner | Bopes Eric S | $176,000 | |
| Previous Owner | Bopes Eric S | $166,250 |
Source: Public Records
Tax History Compared to Growth
Tax History
| Year | Tax Paid | Tax Assessment Tax Assessment Total Assessment is a certain percentage of the fair market value that is determined by local assessors to be the total taxable value of land and additions on the property. | Land | Improvement |
|---|---|---|---|---|
| 2024 | $5,527 | $86,103 | $8,580 | $77,523 |
| 2023 | $4,925 | $79,431 | $7,915 | $71,516 |
| 2022 | $4,600 | $73,141 | $7,288 | $65,853 |
| 2021 | $4,296 | $67,723 | $6,748 | $60,975 |
| 2020 | $4,101 | $65,426 | $6,089 | $59,337 |
| 2019 | $4,038 | $64,449 | $5,998 | $58,451 |
| 2018 | $3,917 | $62,572 | $5,823 | $56,749 |
| 2017 | $3,809 | $60,927 | $5,670 | $55,257 |
| 2016 | $3,596 | $57,750 | $5,374 | $52,376 |
| 2015 | $4,304 | $57,750 | $5,374 | $52,376 |
| 2013 | $4,304 | $74,017 | $5,428 | $68,589 |
Source: Public Records
Map
Nearby Homes
- 209 Lake View Ct
- 55 Rustic Lake Dr
- 104 N 2nd St
- 106 Lakeview Dr
- 109 N 3rd St
- 74 Rustic Lake Dr
- 72 Rustic Lake Dr
- 64 Rustic Lake Dr
- 71 Rustic Lake Dr
- 63 Rustic Lake Dr
- 18 Maple Ct
- 25622 1st Ave N
- 107 Hilltop St
- 9598 Canal Rd
- 26299 1st Ave N
- 108 Andrea Ct
- 5924 Dayton Corner B St
- LOT 49 Rustic Lake Estates
- 4 Maple Ct
- 109 Hillcrest Dr
- 204 Lake View Ct
- 204 Lake View Ct
- 111 N 2nd Ave
- 212 Lake View Ct
- 207 Lake View Ct
- 210 Lake View Ct
- 202 Lake View Ct
- 202 Lake View Ct
- 210 Lake View Ct
- 205 Lake View Ct
- 211 Lake View Ct
- 211 Lake View Ct
- 203 Lake View Ct
- 201 Lake View Ct
- 101 Rustic Lake Ct
- 109 N 2nd St
- 114 N 2nd Ave
- 213 Lake View Ct
- 214 Lake View Ct
- 215 Lake View Ct