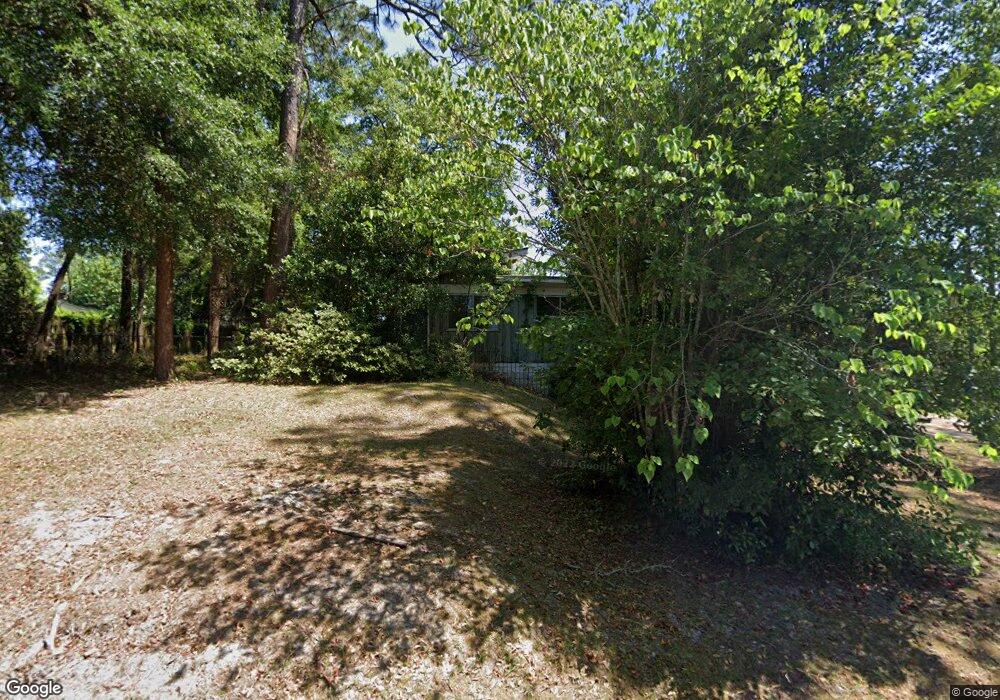
206 Magnolia St Waycross, GA 31501
Estimated Value: $151,000 - $1,048,234
--
Bed
--
Bath
2,456
Sq Ft
$161/Sq Ft
Est. Value
About This Home
This home is located at 206 Magnolia St, Waycross, GA 31501 and is currently estimated at $396,309, approximately $161 per square foot. 206 Magnolia St is a home located in Ware County with nearby schools including Williams Heights Elementary School, Waycross Middle School, and Ware County High School.
Ownership History
Date
Name
Owned For
Owner Type
Purchase Details
Closed on
Aug 1, 2008
Sold by
Wachovia Bank N A
Bought by
Oberry Michael W
Current Estimated Value
Purchase Details
Closed on
Feb 5, 2008
Sold by
Best Nicole
Bought by
Wachovia Bank N A
Purchase Details
Closed on
Dec 15, 2000
Sold by
Barber John D
Bought by
Best Nicole A
Purchase Details
Closed on
Feb 29, 1996
Sold by
Donaldson James H
Bought by
Barber John D
Purchase Details
Closed on
Dec 31, 1985
Create a Home Valuation Report for This Property
The Home Valuation Report is an in-depth analysis detailing your home's value as well as a comparison with similar homes in the area
Home Values in the Area
Average Home Value in this Area
Purchase History
| Date | Buyer | Sale Price | Title Company |
|---|---|---|---|
| Oberry Michael W | $23,200 | -- | |
| Wachovia Bank N A | $56,502 | -- | |
| Best Nicole A | $64,900 | -- | |
| Barber John D | $57,000 | -- | |
| -- | $68,000 | -- |
Source: Public Records
Tax History Compared to Growth
Tax History
| Year | Tax Paid | Tax Assessment Tax Assessment Total Assessment is a certain percentage of the fair market value that is determined by local assessors to be the total taxable value of land and additions on the property. | Land | Improvement |
|---|---|---|---|---|
| 2024 | $662 | $17,934 | $7,680 | $10,254 |
| 2023 | $1,211 | $21,009 | $6,130 | $14,879 |
| 2022 | $837 | $21,009 | $6,130 | $14,879 |
| 2021 | $751 | $17,366 | $6,130 | $11,236 |
| 2020 | $686 | $15,732 | $6,130 | $9,602 |
| 2019 | $680 | $15,391 | $6,130 | $9,261 |
| 2018 | $672 | $15,050 | $6,130 | $8,920 |
| 2017 | $1,404 | $15,050 | $6,130 | $8,920 |
| 2016 | $1,404 | $32,199 | $6,130 | $26,069 |
| 2015 | $1,414 | $32,199 | $6,130 | $26,069 |
| 2014 | $1,412 | $32,199 | $6,130 | $26,069 |
| 2013 | -- | $36,849 | $6,130 | $30,719 |
Source: Public Records
Map
Nearby Homes