Estimated Value: $140,800 - $301,000
3
Beds
3
Baths
2,628
Sq Ft
$76/Sq Ft
Est. Value
About This Home
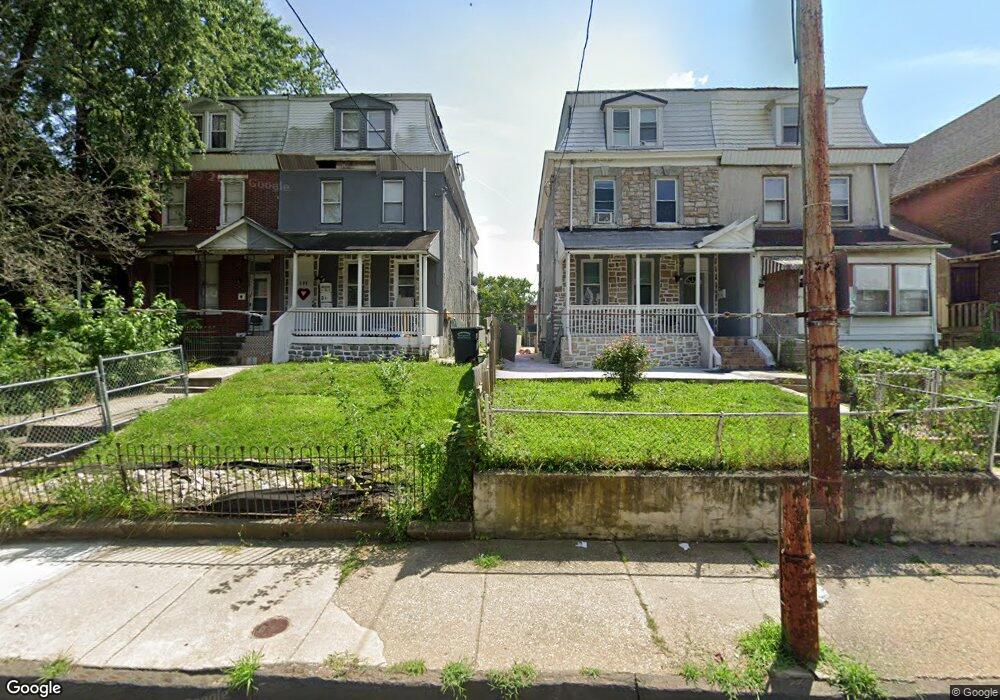
This home is located at 206 Main St, Darby, PA 19023 and is currently estimated at $200,200, approximately $76 per square foot. 206 Main St is a home located in Delaware County with nearby schools including Walnut Street Elementary School, Penn Wood Middle School, and Penn Wood High School - Cypress Street Campus.
Ownership History
Date
Name
Owned For
Owner Type
Purchase Details
Closed on
Jan 19, 2022
Sold by
Philip Roberts
Bought by
Hutchinson Damian Anthony
Current Estimated Value
Purchase Details
Closed on
Jun 9, 2011
Sold by
Nzeribe Eric John
Bought by
Roberts Philip
Purchase Details
Closed on
Mar 26, 2004
Sold by
Watson Lawrence H
Bought by
Nzeribe Eric John
Home Financials for this Owner
Home Financials are based on the most recent Mortgage that was taken out on this home.
Original Mortgage
$64,600
Interest Rate
8.49%
Mortgage Type
Stand Alone First
Create a Home Valuation Report for This Property
The Home Valuation Report is an in-depth analysis detailing your home's value as well as a comparison with similar homes in the area
Home Values in the Area
Average Home Value in this Area
Purchase History
| Date | Buyer | Sale Price | Title Company |
|---|---|---|---|
| Hutchinson Damian Anthony | $25,000 | None Listed On Document | |
| Roberts Philip | $8,105 | None Available | |
| Nzeribe Eric John | $68,000 | Lawyers Title Ins |
Source: Public Records
Mortgage History
| Date | Status | Borrower | Loan Amount |
|---|---|---|---|
| Previous Owner | Nzeribe Eric John | $64,600 |
Source: Public Records
Tax History
| Year | Tax Paid | Tax Assessment Tax Assessment Total Assessment is a certain percentage of the fair market value that is determined by local assessors to be the total taxable value of land and additions on the property. | Land | Improvement |
|---|---|---|---|---|
| 2025 | $4,520 | $85,610 | $20,140 | $65,470 |
| 2024 | $4,458 | $85,610 | $20,140 | $65,470 |
| 2023 | $2,735 | $85,610 | $20,140 | $65,470 |
| 2022 | $4,227 | $85,610 | $20,140 | $65,470 |
| 2021 | $5,847 | $85,610 | $20,140 | $65,470 |
| 2020 | $3,932 | $50,560 | $15,030 | $35,530 |
| 2019 | $3,876 | $50,560 | $15,030 | $35,530 |
| 2018 | $3,833 | $50,560 | $0 | $0 |
| 2017 | $3,769 | $50,560 | $0 | $0 |
| 2016 | $283 | $50,560 | $0 | $0 |
| 2015 | $283 | $50,560 | $0 | $0 |
| 2014 | $283 | $50,560 | $0 | $0 |
Source: Public Records
Map
Nearby Homes
Your Personal Tour Guide
Ask me questions while you tour the home.