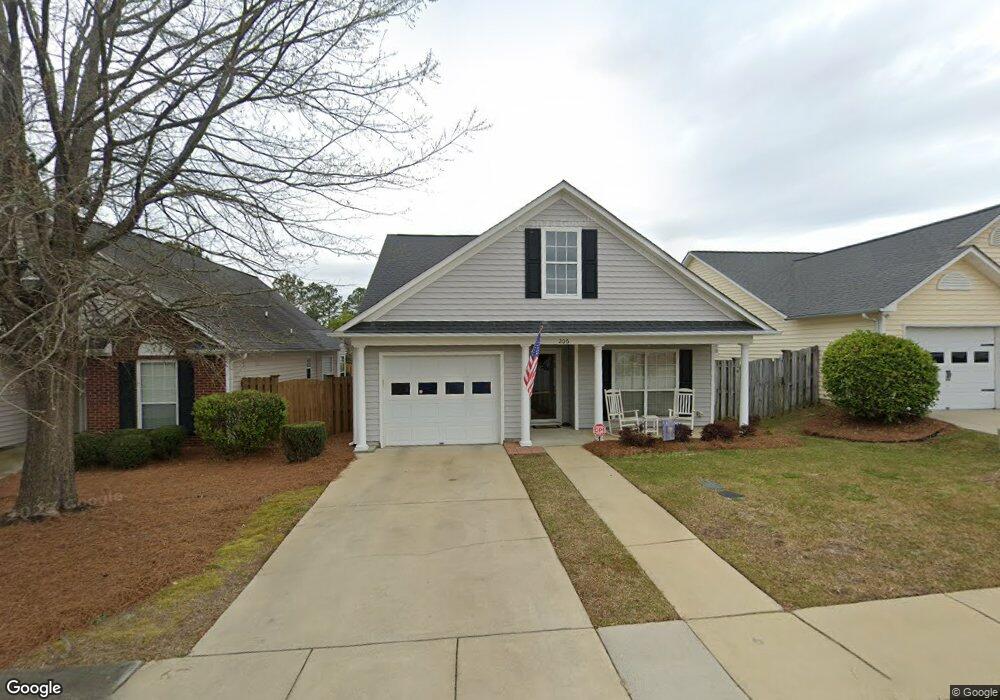
206 Merrimac Ct Lexington, SC 29072
Estimated Value: $222,000 - $264,000
3
Beds
2
Baths
1,542
Sq Ft
$158/Sq Ft
Est. Value
About This Home
This home is located at 206 Merrimac Ct, Lexington, SC 29072 and is currently estimated at $243,950, approximately $158 per square foot. 206 Merrimac Ct is a home located in Lexington County with nearby schools including Lake Murray Elementary School, Beechwood Middle School, and Lexington High School.
Ownership History
Date
Name
Owned For
Owner Type
Purchase Details
Closed on
Dec 3, 2021
Sold by
Myers Katelyn B
Bought by
Mulligan Ronald F
Current Estimated Value
Home Financials for this Owner
Home Financials are based on the most recent Mortgage that was taken out on this home.
Original Mortgage
$205,000
Outstanding Balance
$188,496
Interest Rate
3.09%
Mortgage Type
VA
Estimated Equity
$55,454
Purchase Details
Closed on
Aug 6, 2019
Sold by
Martin Rocio
Bought by
Myers Katelyn B
Home Financials for this Owner
Home Financials are based on the most recent Mortgage that was taken out on this home.
Original Mortgage
$142,373
Interest Rate
3.62%
Mortgage Type
FHA
Purchase Details
Closed on
Oct 15, 2012
Sold by
Dilorenzo Patricia E
Bought by
Martin Rocio
Home Financials for this Owner
Home Financials are based on the most recent Mortgage that was taken out on this home.
Original Mortgage
$90,000
Interest Rate
3.58%
Mortgage Type
Future Advance Clause Open End Mortgage
Purchase Details
Closed on
Aug 26, 2008
Sold by
Dilorenzo Patricia E
Bought by
Dilorenzo Patricia E and Donovan Florence T
Create a Home Valuation Report for This Property
The Home Valuation Report is an in-depth analysis detailing your home's value as well as a comparison with similar homes in the area
Home Values in the Area
Average Home Value in this Area
Purchase History
| Date | Buyer | Sale Price | Title Company |
|---|---|---|---|
| Mulligan Ronald F | $205,000 | None Available | |
| Myers Katelyn B | $145,000 | None Available | |
| Martin Rocio | $100,000 | -- | |
| Dilorenzo Patricia E | -- | -- |
Source: Public Records
Mortgage History
| Date | Status | Borrower | Loan Amount |
|---|---|---|---|
| Open | Mulligan Ronald F | $205,000 | |
| Previous Owner | Myers Katelyn B | $142,373 | |
| Previous Owner | Martin Rocio | $90,000 |
Source: Public Records
Tax History Compared to Growth
Tax History
| Year | Tax Paid | Tax Assessment Tax Assessment Total Assessment is a certain percentage of the fair market value that is determined by local assessors to be the total taxable value of land and additions on the property. | Land | Improvement |
|---|---|---|---|---|
| 2024 | $963 | $8,200 | $1,400 | $6,800 |
| 2023 | $963 | $8,200 | $1,400 | $6,800 |
| 2022 | $970 | $8,200 | $1,400 | $6,800 |
| 2020 | $1,037 | $5,800 | $1,200 | $4,600 |
| 2019 | $873 | $4,600 | $952 | $3,648 |
| 2018 | $860 | $4,600 | $952 | $3,648 |
| 2017 | $839 | $4,600 | $952 | $3,648 |
| 2016 | $832 | $4,599 | $951 | $3,648 |
| 2014 | $702 | $3,999 | $1,000 | $2,999 |
| 2013 | -- | $4,000 | $1,000 | $3,000 |
Source: Public Records
Map
Nearby Homes
- 108 Dupre Mill Rd
- 108 Misty Dew Ln
- 247 Clearbrook Cir
- 213 Dove Chase Trail
- 141 Autumn Stroll Ct
- 157 Autumn Stroll Ct
- 605 Bronze Fantail Run
- 524 Silver Dipper Run
- 413 Jordan Way
- 222 Forgotten Trail
- 218 Forgotten Trail
- 214 Forgotten Trail
- 220 Forgotten Trail
- 216 Forgotten Trail
- 208 Forgotten Trail
- 224 Forgotten Trail
- 204 Forgotten Trail
- 200 Forgotten Trail
- 206 Forgotten Trail
- 210 Forgotten Trail
- 204 Merrimac Ct
- 208 Merrimac Ct
- 107 Garden Arbor Ct
- 202 Merrimac Ct
- 210 Merrimac Ct
- 107 Merrimac Ct
- 107 Merrimac Ct Unit 70
- 103 Garden Arbor Ct
- 206 Garden Arbor Ct
- 106 Merrimac Ct
- 204 Garden Arbor Ct
- 105 Merrimac Ct
- 104 Merrimac Ct
- 109 Wilmington Ln
- 111 Wilmington Ln
- 202 Garden Arbor Ct
- 103 Merrimac Ct
- 107 Wilmington Ln
- 106 Garden Arbor Ct
- 102 Merrimac Ct