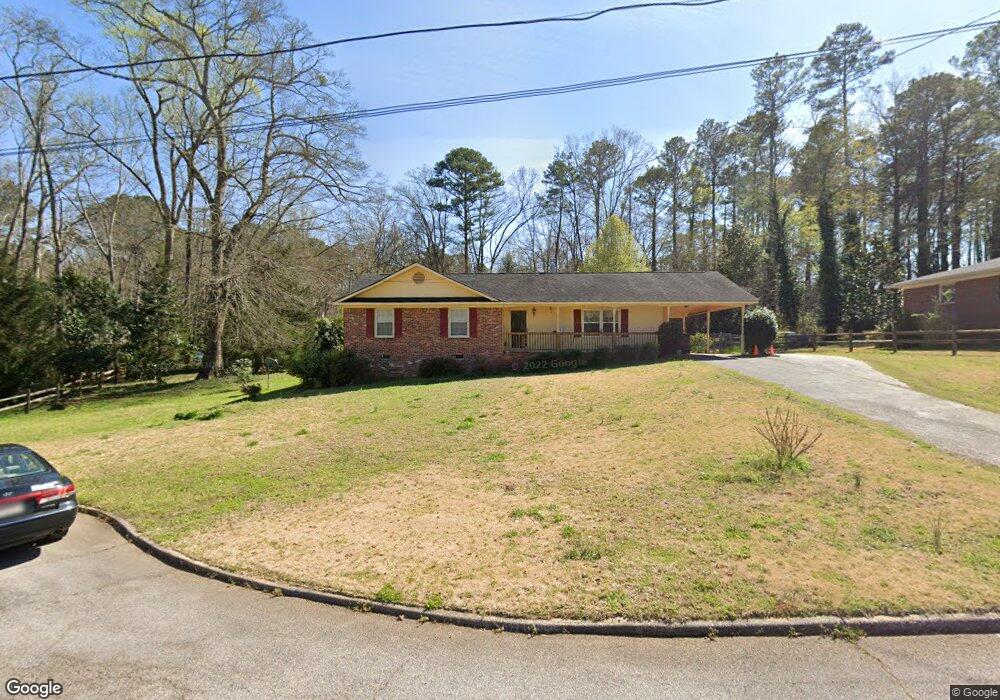
206 Mimosa Terrace Unit 18 Lagrange, GA 30241
Estimated Value: $204,000 - $218,386
3
Beds
2
Baths
1,640
Sq Ft
$129/Sq Ft
Est. Value
About This Home
This home is located at 206 Mimosa Terrace Unit 18, Lagrange, GA 30241 and is currently estimated at $211,347, approximately $128 per square foot. 206 Mimosa Terrace Unit 18 is a home located in Troup County with nearby schools including Franklin Forest Elementary School, Hollis Hand Elementary School, and Ethel W. Kight Elementary School.
Ownership History
Date
Name
Owned For
Owner Type
Purchase Details
Closed on
Jun 23, 2020
Sold by
Kim Sun K
Bought by
Kim Sun K and Kim Mi Sun
Current Estimated Value
Home Financials for this Owner
Home Financials are based on the most recent Mortgage that was taken out on this home.
Original Mortgage
$121,754
Outstanding Balance
$106,996
Interest Rate
3.1%
Mortgage Type
FHA
Estimated Equity
$104,351
Purchase Details
Closed on
Dec 30, 1998
Sold by
Buttrum Charlie
Bought by
Martin Hugh M and Martin Victoria L
Purchase Details
Closed on
Dec 13, 1975
Sold by
Jackson Donald R and Jackson Suzanne G
Bought by
Buttrum Charlie
Purchase Details
Closed on
Mar 28, 1974
Sold by
Kemp Gurald W and Wanda Gail
Bought by
Jackson Donald R and Jackson Suzanne G
Purchase Details
Closed on
Jan 1, 1972
Sold by
Loftin James and Loftin Sherill
Bought by
Kemp Gurald W and Wanda Gail
Create a Home Valuation Report for This Property
The Home Valuation Report is an in-depth analysis detailing your home's value as well as a comparison with similar homes in the area
Purchase History
| Date | Buyer | Sale Price | Title Company |
|---|---|---|---|
| Kim Sun K | -- | -- | |
| Kim Sun K | $124,000 | -- | |
| Martin Hugh M | $89,000 | -- | |
| Buttrum Charlie | $37,000 | -- | |
| Jackson Donald R | $32,000 | -- | |
| Kemp Gurald W | $28,000 | -- | |
| Loftin James | -- | -- |
Source: Public Records
Mortgage History
| Date | Status | Borrower | Loan Amount |
|---|---|---|---|
| Open | Kim Sun K | $121,754 |
Source: Public Records
Tax History
| Year | Tax Paid | Tax Assessment Tax Assessment Total Assessment is a certain percentage of the fair market value that is determined by local assessors to be the total taxable value of land and additions on the property. | Land | Improvement |
|---|---|---|---|---|
| 2025 | $1,582 | $66,788 | $10,000 | $56,788 |
| 2024 | $1,582 | $59,988 | $10,000 | $49,988 |
| 2023 | $1,480 | $56,268 | $10,000 | $46,268 |
| 2022 | $1,506 | $53,948 | $10,000 | $43,948 |
| 2021 | $1,438 | $47,672 | $6,920 | $40,752 |
| 2020 | $1,073 | $37,552 | $6,920 | $30,632 |
| 2019 | $933 | $32,916 | $5,400 | $27,516 |
| 2018 | $933 | $32,916 | $5,400 | $27,516 |
| 2017 | $933 | $32,916 | $5,400 | $27,516 |
| 2016 | $905 | $31,988 | $5,400 | $26,588 |
| 2015 | $902 | $31,842 | $6,536 | $25,306 |
| 2014 | $863 | $30,510 | $6,536 | $23,974 |
| 2013 | -- | $32,246 | $6,536 | $25,710 |
Source: Public Records
Map
Nearby Homes
- 806 New Franklin Rd
- 114 Briarcliff Rd
- 202 Park Hill Dr
- 204 Colonial St
- 110 Russell St
- 900 North St
- 102 Dogwood Dr
- 134 S Page St
- 109 Thomas St
- 219 Banks St
- 203 Bonaventure Dr
- 706 N Harlem Cir
- 106 Ewing St
- 222 Beechwood Cir
- 210 Hearthstone Dr
- 224 Rutland Cir
- 600 S Harlem Cir
- 606 S Harlem Cir
- 608 S Harlem Cir
- 724 Camellia Dr
- 206 Mimosa Terrace
- 204 Mimosa Terrace
- 221 Merrybrook Dr
- 225 Merrybrook Dr
- 208 Mimosa Terrace
- 219 Merrybrook Dr
- 205 Mimosa Terrace
- 202 Mimosa Terrace
- 203 Mimosa Terrace
- 0 Mimosa Terrace Unit 8046804
- 209 Mimosa Terrace
- 217 Merrybrook Dr
- 207 Mimosa Terrace
- 201 Mimosa Terrace
- 217 Laurel Ln
- 172 Merrybrook Dr
- 229 Laurel Ln
- 215 Laurel Ln
- 200 Mimosa Terrace
- 190 Mimosa Terrace
Your Personal Tour Guide
Ask me questions while you tour the home.