Estimated Value: $151,000 - $200,000
4
Beds
2
Baths
1,742
Sq Ft
$99/Sq Ft
Est. Value
About This Home
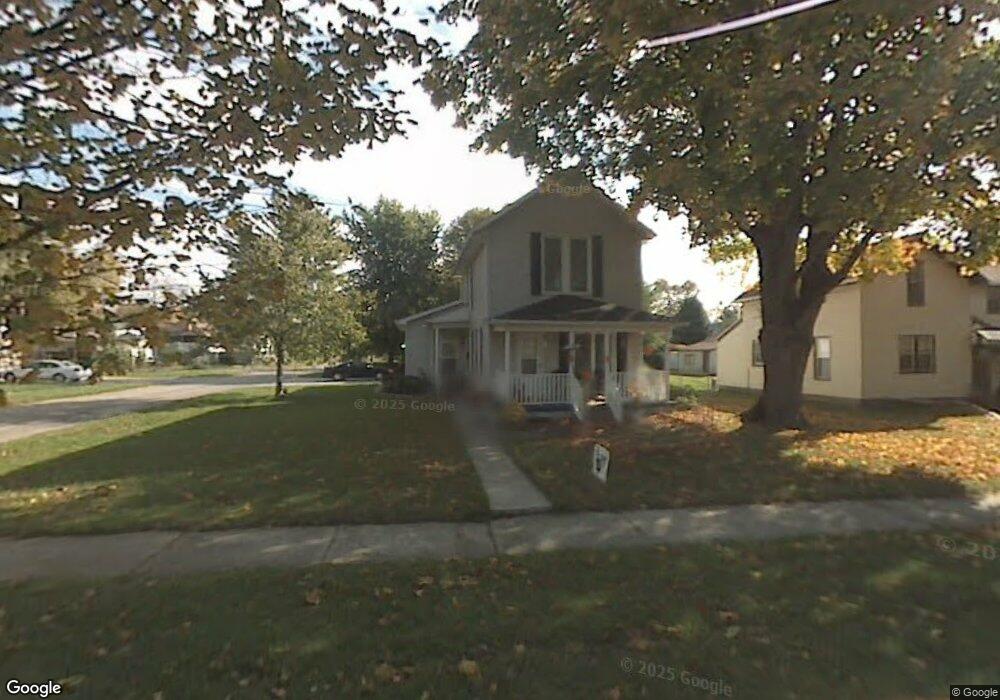
This home is located at 206 Monroe St, Delta, OH 43515 and is currently estimated at $171,731, approximately $98 per square foot. 206 Monroe St is a home located in Fulton County with nearby schools including Delta Elementary School, Pike-Delta-York Middle School, and Pike-Delta-York High School.
Ownership History
Date
Name
Owned For
Owner Type
Purchase Details
Closed on
Dec 30, 2024
Sold by
Stephen D Roth And Becky M Fultz-Roth Re and Roth Stephen D
Bought by
Snyder Mark D and Synder Robert F
Current Estimated Value
Home Financials for this Owner
Home Financials are based on the most recent Mortgage that was taken out on this home.
Original Mortgage
$151,200
Outstanding Balance
$149,974
Interest Rate
6.63%
Mortgage Type
New Conventional
Estimated Equity
$21,757
Purchase Details
Closed on
Sep 15, 2021
Sold by
Fultz Roth Becky M
Bought by
Roth Stephen D and Roth Becky
Purchase Details
Closed on
Aug 19, 2004
Sold by
Aguirre Joann B
Bought by
Fultz Roth Becky M
Purchase Details
Closed on
Jan 1, 1990
Bought by
Aguirre Frank and Aguirre Joann B
Create a Home Valuation Report for This Property
The Home Valuation Report is an in-depth analysis detailing your home's value as well as a comparison with similar homes in the area
Home Values in the Area
Average Home Value in this Area
Purchase History
| Date | Buyer | Sale Price | Title Company |
|---|---|---|---|
| Snyder Mark D | $189,000 | Louisville Title | |
| Snyder Mark D | $189,000 | Louisville Title | |
| Snyder Mark D | $189,000 | Louisville Title | |
| Roth Stephen D | -- | None Available | |
| Fultz Roth Becky M | $100,000 | Northwest Title Agency Of Oh | |
| Aguirre Frank | -- | -- |
Source: Public Records
Mortgage History
| Date | Status | Borrower | Loan Amount |
|---|---|---|---|
| Open | Snyder Mark D | $151,200 | |
| Closed | Snyder Mark D | $151,200 |
Source: Public Records
Tax History
| Year | Tax Paid | Tax Assessment Tax Assessment Total Assessment is a certain percentage of the fair market value that is determined by local assessors to be the total taxable value of land and additions on the property. | Land | Improvement |
|---|---|---|---|---|
| 2024 | $2,127 | $48,930 | $6,930 | $42,000 |
| 2023 | $2,127 | $48,930 | $6,930 | $42,000 |
| 2022 | $2,170 | $38,090 | $5,780 | $32,310 |
| 2021 | $2,246 | $38,090 | $5,780 | $32,310 |
| 2020 | $2,234 | $38,090 | $5,780 | $32,310 |
| 2019 | $1,980 | $34,520 | $5,780 | $28,740 |
| 2018 | $1,016 | $34,520 | $5,780 | $28,740 |
| 2017 | $2,017 | $34,520 | $5,780 | $28,740 |
| 2016 | $1,764 | $29,510 | $5,780 | $23,730 |
| 2015 | $1,690 | $29,510 | $5,780 | $23,730 |
| 2014 | $1,687 | $29,510 | $5,780 | $23,730 |
| 2013 | $1,443 | $25,450 | $5,110 | $20,340 |
Source: Public Records
Map
Nearby Homes
- 207 Wood St
- 308 Monroe St
- 305 Mckinley St
- 518 Providence St
- 929 Linwood Ave
- 8069 Fulton County 7-2
- 8069 County Road 7
- 2049 Pear Tree Ln
- 318 Hidden Ridge Dr
- 2061 Redbud Ln
- 315 Cherrytree Ln
- 2158 Redbud Ln
- 320 Crabtree Ln
- 9136 County Road Ef
- 3088 County Road H
- 11470 County Rd E
- 3121 County Road Ef
- 7373 County Road 12
- 6881 County Road B
- 4465 County Road 3
Your Personal Tour Guide
Ask me questions while you tour the home.