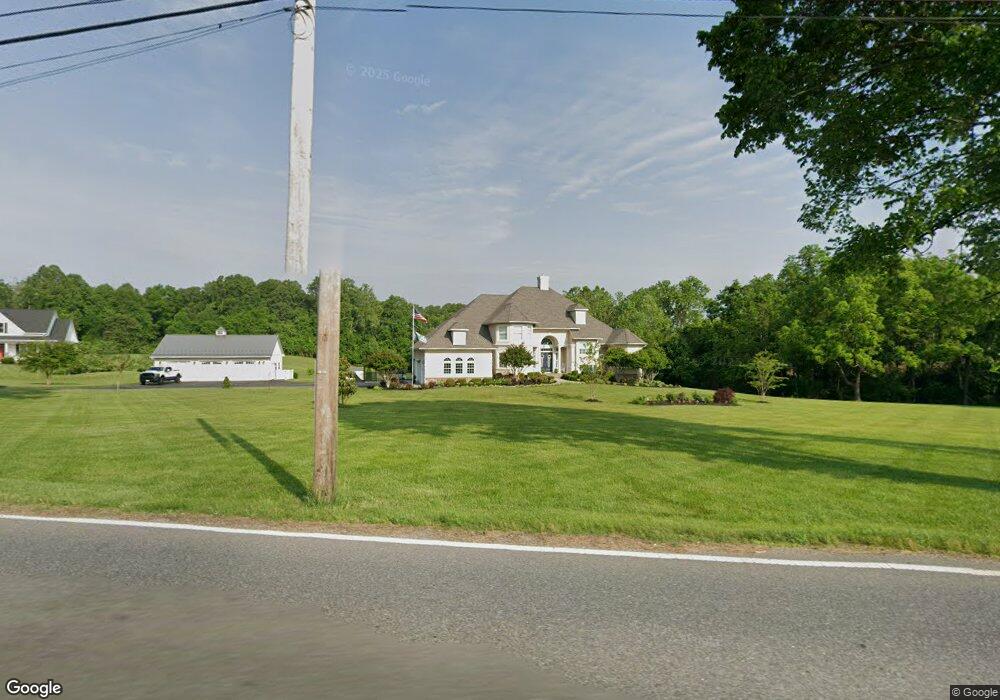
206 Mt Zion Marlboro Rd Lothian, MD 20711
Estimated Value: $1,241,000 - $1,908,726
5
Beds
6
Baths
6,747
Sq Ft
$221/Sq Ft
Est. Value
About This Home
This home is located at 206 Mt Zion Marlboro Rd, Lothian, MD 20711 and is currently estimated at $1,489,575, approximately $220 per square foot. 206 Mt Zion Marlboro Rd is a home located in Anne Arundel County with nearby schools including Lothian Elementary School, Southern Middle School, and Southern High School.
Ownership History
Date
Name
Owned For
Owner Type
Purchase Details
Closed on
Dec 3, 2020
Sold by
Martin Ronald C and Martin Staci G
Bought by
Martin Ronald Craig and Ronald Craig Martin Revocable
Current Estimated Value
Purchase Details
Closed on
May 25, 2018
Sold by
Lowman Frank T and Siegert Shirley A
Bought by
Martin Ronald C and Martin Staci G
Home Financials for this Owner
Home Financials are based on the most recent Mortgage that was taken out on this home.
Original Mortgage
$792,000
Outstanding Balance
$723,320
Interest Rate
7.5%
Mortgage Type
Adjustable Rate Mortgage/ARM
Estimated Equity
$766,255
Purchase Details
Closed on
Nov 3, 2005
Sold by
Chaney William Franklin
Bought by
Lowman Frank T and Siegert David L
Purchase Details
Closed on
Oct 6, 2005
Sold by
Chaney William Franklin
Bought by
Lowman Frank T and Siegert David L
Create a Home Valuation Report for This Property
The Home Valuation Report is an in-depth analysis detailing your home's value as well as a comparison with similar homes in the area
Home Values in the Area
Average Home Value in this Area
Purchase History
| Date | Buyer | Sale Price | Title Company |
|---|---|---|---|
| Martin Ronald Craig | -- | None Available | |
| Martin Ronald C | $880,000 | Liberty Title & Escrow Of Ma | |
| Lowman Frank T | $350,000 | -- | |
| Lowman Frank T | $350,000 | -- |
Source: Public Records
Mortgage History
| Date | Status | Borrower | Loan Amount |
|---|---|---|---|
| Open | Martin Ronald C | $792,000 | |
| Closed | Lowman Frank T | -- |
Source: Public Records
Tax History Compared to Growth
Tax History
| Year | Tax Paid | Tax Assessment Tax Assessment Total Assessment is a certain percentage of the fair market value that is determined by local assessors to be the total taxable value of land and additions on the property. | Land | Improvement |
|---|---|---|---|---|
| 2025 | $15,840 | $1,518,600 | -- | -- |
| 2024 | $15,840 | $1,386,200 | $0 | $0 |
| 2023 | $14,319 | $1,253,800 | $159,900 | $1,093,900 |
| 2022 | $13,095 | $1,197,700 | $0 | $0 |
| 2021 | $25,018 | $1,141,600 | $0 | $0 |
| 2020 | $7,153 | $1,085,500 | $142,400 | $943,100 |
| 2019 | $7,160 | $1,085,500 | $142,400 | $943,100 |
| 2018 | $11,007 | $1,085,500 | $142,400 | $943,100 |
| 2017 | $12,451 | $1,194,300 | $0 | $0 |
| 2016 | -- | $1,160,967 | $0 | $0 |
| 2015 | -- | $1,127,633 | $0 | $0 |
| 2014 | -- | $1,094,300 | $0 | $0 |
Source: Public Records
Map
Nearby Homes
- 201 Biggs Purchase Ln
- 674 Teton Dr
- 9 Solitude Ct
- 5292 Moreland Rd
- 600 Traveller Ct
- 612 Traveller Ct
- 623 Traveller Ct
- 49 Old Solomons Island Rd
- 5485 Solomons Island Rd
- 4440 Claybrooke Dr
- 5257 Ferry Branch Ln
- 5248 Ferry Branch Ln
- 896 Mount Zion Marlboro Rd
- 4485 Old Solomons Island Rd
- 5534 Nutwell Sudley Rd
- 204 Three Rivers Rd
- 997 Mount Zion Marlboro Rd
- 460 Sarah Anne Dr
- 484 Keith Ct
- 21 Treiber Ln
- 206 Marlboro Rd
- 206 Mount Zion Marlboro Rd
- 201 Marlboro Rd
- 195 Mount Zion Marlboro Rd
- 208 Marlboro Rd
- 212 Marlboro Rd
- 215 Marlboro Rd
- 5115 Moreland Ln
- 195 Marlboro Rd
- 218 Mt Zion Marlboro Rd
- 200 Marlboro Rd
- 200 Marlboro Rd
- 5125 Moreland Ln
- 218 Marlboro Rd
- 223 Marlboro Rd
- 193 Marlboro Rd
- 193 Mount Zion Marlboro Rd
- 231 Marlboro Rd
- 5130 Moreland Ln
- 204 Marlboro Rd