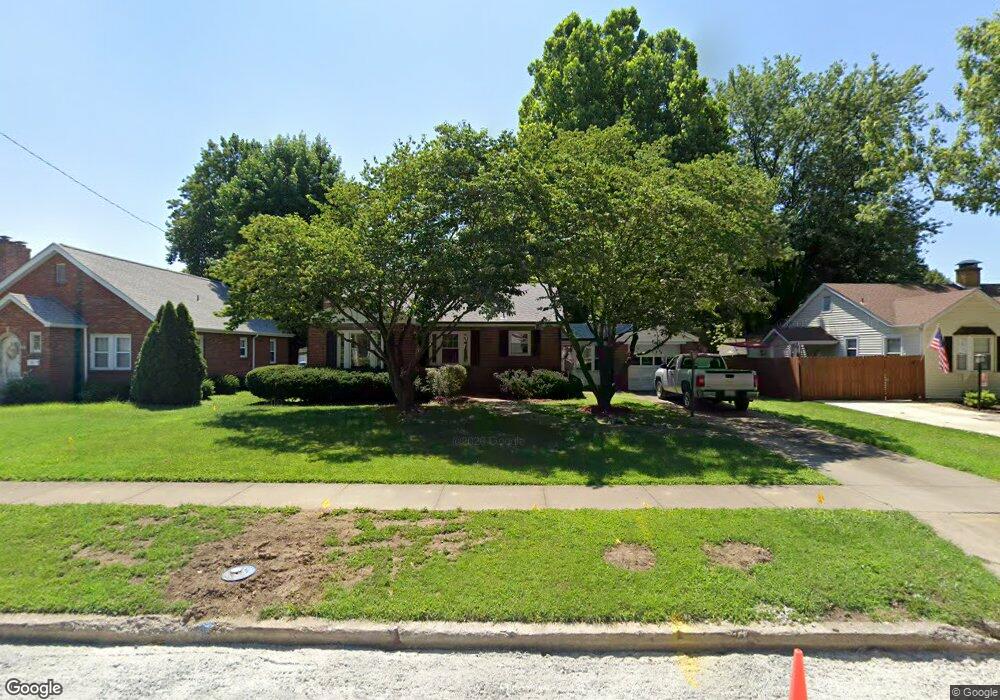
206 N 38th St Belleville, IL 62226
Estimated Value: $123,235 - $154,000
--
Bed
--
Bath
1,090
Sq Ft
$132/Sq Ft
Est. Value
About This Home
This home is located at 206 N 38th St, Belleville, IL 62226 and is currently estimated at $144,059, approximately $132 per square foot. 206 N 38th St is a home located in St. Clair County with nearby schools including Union Elementary School, West Jr High School, and Our Lady Queen Of Peace Catholic School.
Ownership History
Date
Name
Owned For
Owner Type
Purchase Details
Closed on
Dec 29, 2014
Sold by
Jones Thomas M and Jones Christine
Bought by
Jones Thomas M
Current Estimated Value
Purchase Details
Closed on
Oct 10, 2012
Sold by
Jones Thomas M
Bought by
Jones Thomas M and Jones Chrstine
Home Financials for this Owner
Home Financials are based on the most recent Mortgage that was taken out on this home.
Original Mortgage
$59,500
Outstanding Balance
$40,929
Interest Rate
3.37%
Mortgage Type
New Conventional
Estimated Equity
$103,130
Purchase Details
Closed on
Nov 30, 1998
Bought by
Jones Thomas M
Create a Home Valuation Report for This Property
The Home Valuation Report is an in-depth analysis detailing your home's value as well as a comparison with similar homes in the area
Home Values in the Area
Average Home Value in this Area
Purchase History
| Date | Buyer | Sale Price | Title Company |
|---|---|---|---|
| Jones Thomas M | -- | None Available | |
| Jones Thomas M | -- | None Available | |
| Jones Thomas M | $59,900 | -- |
Source: Public Records
Mortgage History
| Date | Status | Borrower | Loan Amount |
|---|---|---|---|
| Open | Jones Thomas M | $59,500 |
Source: Public Records
Tax History Compared to Growth
Tax History
| Year | Tax Paid | Tax Assessment Tax Assessment Total Assessment is a certain percentage of the fair market value that is determined by local assessors to be the total taxable value of land and additions on the property. | Land | Improvement |
|---|---|---|---|---|
| 2024 | $2,879 | $40,740 | $5,451 | $35,289 |
| 2023 | $2,869 | $38,563 | $5,342 | $33,221 |
| 2022 | $2,748 | $34,716 | $4,809 | $29,907 |
| 2021 | $2,402 | $32,094 | $4,446 | $27,648 |
| 2020 | $2,301 | $30,351 | $4,205 | $26,146 |
| 2019 | $2,449 | $29,635 | $4,212 | $25,423 |
| 2018 | $2,381 | $28,994 | $4,121 | $24,873 |
| 2017 | $2,364 | $28,790 | $4,092 | $24,698 |
| 2016 | $2,328 | $28,178 | $4,005 | $24,173 |
| 2014 | $1,779 | $25,244 | $4,622 | $20,622 |
| 2013 | $1,811 | $25,605 | $4,688 | $20,917 |
Source: Public Records
Map
Nearby Homes