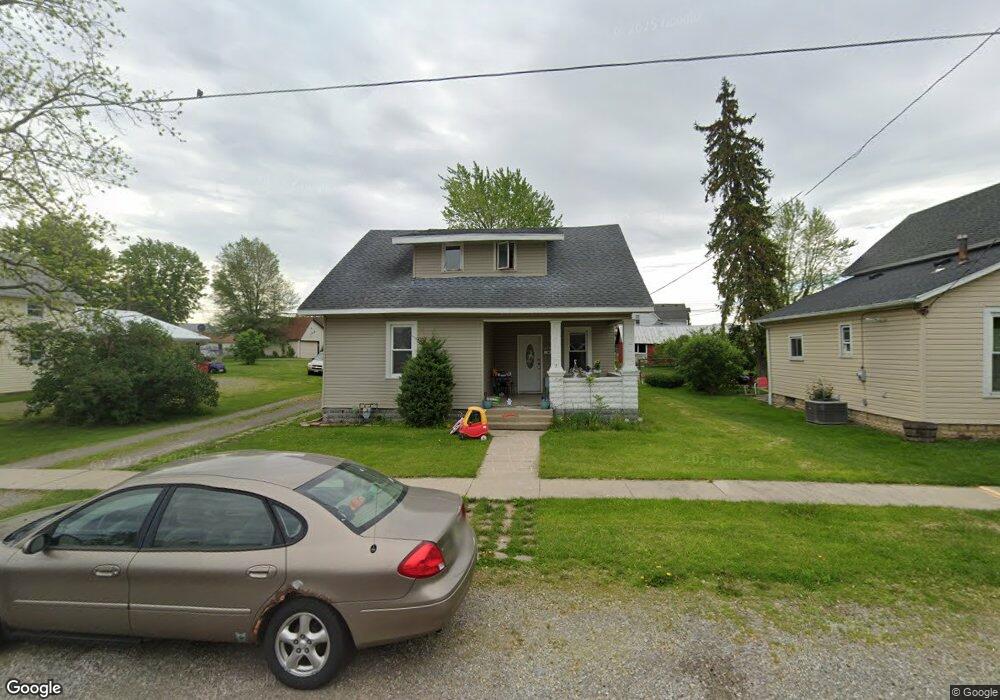
206 N Mulberry St Spencerville, OH 45887
Estimated Value: $110,000 - $181,000
3
Beds
2
Baths
1,398
Sq Ft
$106/Sq Ft
Est. Value
About This Home
This home is located at 206 N Mulberry St, Spencerville, OH 45887 and is currently estimated at $148,062, approximately $105 per square foot. 206 N Mulberry St is a home located in Allen County with nearby schools including Spencerville Elementary School, Spencerville Middle School, and Spencerville High School.
Ownership History
Date
Name
Owned For
Owner Type
Purchase Details
Closed on
Dec 20, 2022
Sold by
Gales Laverne S and Gales Janet A
Bought by
Ten Of Hearts Llc
Current Estimated Value
Home Financials for this Owner
Home Financials are based on the most recent Mortgage that was taken out on this home.
Original Mortgage
$1,225,000
Outstanding Balance
$1,136,058
Interest Rate
6.61%
Mortgage Type
New Conventional
Estimated Equity
-$987,996
Purchase Details
Closed on
Sep 16, 2009
Sold by
Citimortgage Inc
Bought by
Gales Ii Laverne S and Gales Janet
Purchase Details
Closed on
May 11, 2009
Sold by
Shaw Benjamin A and Shaw Lydia
Bought by
Citimortgage Inc
Purchase Details
Closed on
Aug 9, 2000
Sold by
Trst Ned E Wurster
Bought by
Boughan Todd E and Boughan Diane C
Purchase Details
Closed on
Mar 1, 1973
Bought by
Wurster Ned E
Create a Home Valuation Report for This Property
The Home Valuation Report is an in-depth analysis detailing your home's value as well as a comparison with similar homes in the area
Home Values in the Area
Average Home Value in this Area
Purchase History
| Date | Buyer | Sale Price | Title Company |
|---|---|---|---|
| Ten Of Hearts Llc | $1,260,000 | -- | |
| Gales Ii Laverne S | $18,200 | None Available | |
| Citimortgage Inc | $40,082 | None Available | |
| Boughan Todd E | $53,200 | -- | |
| Wurster Ned E | $9,000 | -- |
Source: Public Records
Mortgage History
| Date | Status | Borrower | Loan Amount |
|---|---|---|---|
| Open | Ten Of Hearts Llc | $1,225,000 |
Source: Public Records
Tax History Compared to Growth
Tax History
| Year | Tax Paid | Tax Assessment Tax Assessment Total Assessment is a certain percentage of the fair market value that is determined by local assessors to be the total taxable value of land and additions on the property. | Land | Improvement |
|---|---|---|---|---|
| 2024 | $975 | $28,630 | $5,950 | $22,680 |
| 2023 | $855 | $23,460 | $4,870 | $18,590 |
| 2022 | $868 | $23,460 | $4,870 | $18,590 |
| 2021 | $848 | $23,460 | $4,870 | $18,590 |
| 2020 | $763 | $20,270 | $4,590 | $15,680 |
| 2019 | $763 | $20,270 | $4,590 | $15,680 |
| 2018 | $709 | $20,270 | $4,590 | $15,680 |
| 2017 | $645 | $17,230 | $4,590 | $12,640 |
| 2016 | $634 | $17,230 | $4,590 | $12,640 |
| 2015 | $648 | $17,230 | $4,590 | $12,640 |
| 2014 | $648 | $17,580 | $4,800 | $12,780 |
| 2013 | $658 | $17,580 | $4,800 | $12,780 |
Source: Public Records
Map
Nearby Homes
- 336 W 4th St
- 213 N Pearl St
- 408 N Mulberry St
- 425 N Main St
- 409 W 4th St
- 316 E 4th St
- 440 W 4th St
- 406 S Mulberry St
- 521 S Broadway St
- 123 Oakland Ave
- 714 Briggs Ave Unit 1
- 00 Kleinoeder Rd
- 14101 Allentown Rd
- 21197 Ohio 116
- 21183 Ohio 116
- 21302 Masters Rd
- 22284 Ohio 198
- 7470 Fort Amanda Rd
- 18341 Saint Marys River Rd
- 1069 S Kemp Rd