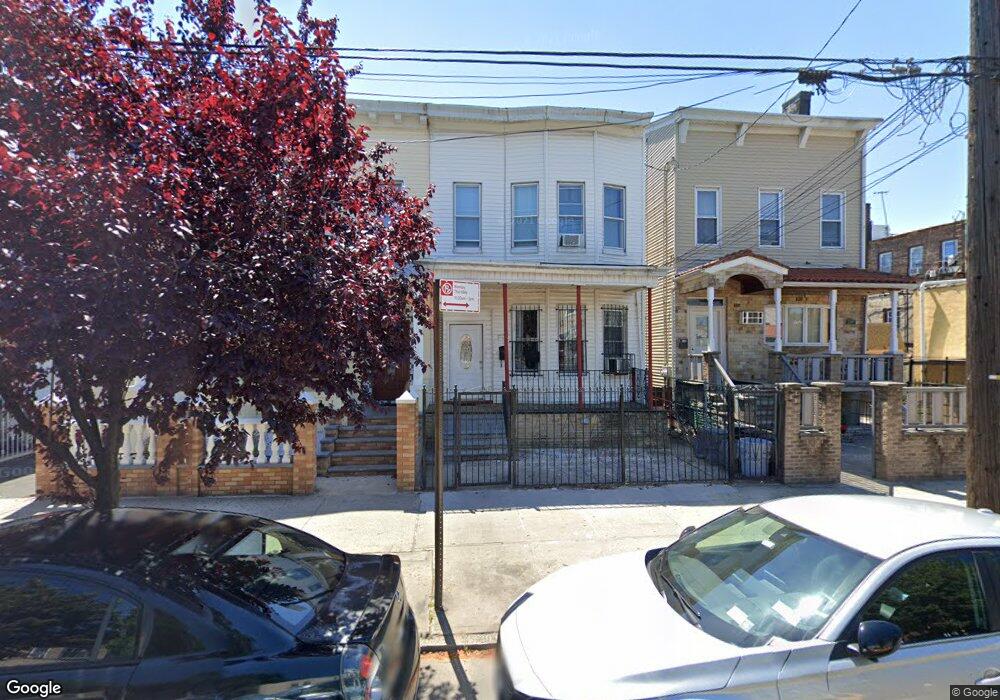
206 Norwood Ave Brooklyn, NY 11208
Cypress Hills NeighborhoodEstimated Value: $834,255 - $1,125,000
5
Beds
3
Baths
1,940
Sq Ft
$498/Sq Ft
Est. Value
About This Home
This home is located at 206 Norwood Ave, Brooklyn, NY 11208 and is currently estimated at $966,064, approximately $497 per square foot. 206 Norwood Ave is a home located in Kings County with nearby schools including P.S. 108 - Sal Abbracciamento, Liberty Avenue Middle School, and Vista Academy.
Ownership History
Date
Name
Owned For
Owner Type
Purchase Details
Closed on
Jan 12, 2017
Sold by
206 Norwood Llc
Bought by
Wu Weihua
Current Estimated Value
Home Financials for this Owner
Home Financials are based on the most recent Mortgage that was taken out on this home.
Original Mortgage
$260,000
Outstanding Balance
$213,277
Interest Rate
4.13%
Mortgage Type
New Conventional
Estimated Equity
$752,787
Purchase Details
Closed on
Dec 17, 2014
Sold by
Persaud Hardai
Bought by
206 Norwood Llc
Purchase Details
Closed on
Feb 7, 2001
Sold by
Jagarnath Bhanmattie
Bought by
Persaud Hardai
Purchase Details
Closed on
Aug 26, 1997
Sold by
Jagarnath Anand P
Bought by
Jagarnath Bhanmattie and Persaud Hardai
Create a Home Valuation Report for This Property
The Home Valuation Report is an in-depth analysis detailing your home's value as well as a comparison with similar homes in the area
Home Values in the Area
Average Home Value in this Area
Purchase History
| Date | Buyer | Sale Price | Title Company |
|---|---|---|---|
| Wu Weihua | $600,000 | -- | |
| Wu Weihua | $600,000 | -- | |
| Wu Weihua | $600,000 | -- | |
| 206 Norwood Llc | -- | -- | |
| 206 Norwood Llc | -- | -- | |
| 206 Norwood Llc | -- | -- | |
| Persaud Hardai | -- | -- | |
| Persaud Hardai | -- | -- | |
| Jagarnath Bhanmattie | -- | First American Title Ins Co | |
| Jagarnath Bhanmattie | -- | First American Title Ins Co |
Source: Public Records
Mortgage History
| Date | Status | Borrower | Loan Amount |
|---|---|---|---|
| Open | Wu Weihua | $260,000 | |
| Closed | Wu Weihua | $260,000 |
Source: Public Records
Tax History Compared to Growth
Tax History
| Year | Tax Paid | Tax Assessment Tax Assessment Total Assessment is a certain percentage of the fair market value that is determined by local assessors to be the total taxable value of land and additions on the property. | Land | Improvement |
|---|---|---|---|---|
| 2025 | $4,576 | $50,220 | $15,360 | $34,860 |
| 2024 | $4,576 | $49,140 | $15,360 | $33,780 |
| 2023 | $4,366 | $42,900 | $15,360 | $27,540 |
| 2022 | $4,248 | $35,100 | $15,360 | $19,740 |
| 2021 | $4,230 | $35,340 | $15,360 | $19,980 |
| 2020 | $3,172 | $42,840 | $15,360 | $27,480 |
| 2019 | $3,972 | $41,100 | $15,360 | $25,740 |
| 2018 | $3,652 | $17,914 | $9,695 | $8,219 |
| 2017 | $3,615 | $17,733 | $7,747 | $9,986 |
| 2016 | $3,348 | $16,748 | $8,120 | $8,628 |
| 2015 | $2,018 | $16,744 | $10,442 | $6,302 |
| 2014 | $2,018 | $15,823 | $9,719 | $6,104 |
Source: Public Records
Map
Nearby Homes
- 225 Hale Ave Unit HSE
- 133 Highland Place
- 120 Highland Place
- 0 Force Tube Ave
- 324 Arlington Ave
- 196 Shepherd Ave
- 37 Montauk Ave
- 147 Essex St
- 203 Essex St
- 3225 Fulton St
- 255 Ridgewood Ave
- 120 Essex St
- 68 Norwood Ave
- 73 Milford St
- 344 Logan St
- 36 Hale Ave
- 90 Milford St
- 283 Shepherd Ave
- 80 Etna St
- 92 Fountain Ave
- 204 Norwood Ave
- 208 Norwood Ave
- 210 Norwood Ave
- 212 Norwood Ave
- 3134 Fulton St
- 3132 Fulton St
- 3126 Fulton St
- 214 Norwood Ave
- 3138 Fulton St
- 3124 Fulton St
- 3124 Fulton St Unit 1FL
- 3130 Fulton St
- 216 Norwood Ave
- 3122 Fulton St
- 218 Norwood Ave
- 165 Hale Ave
- 167 Hale Ave
- 169 Hale Ave
- 222 Norwood Ave
- 3118 Fulton St