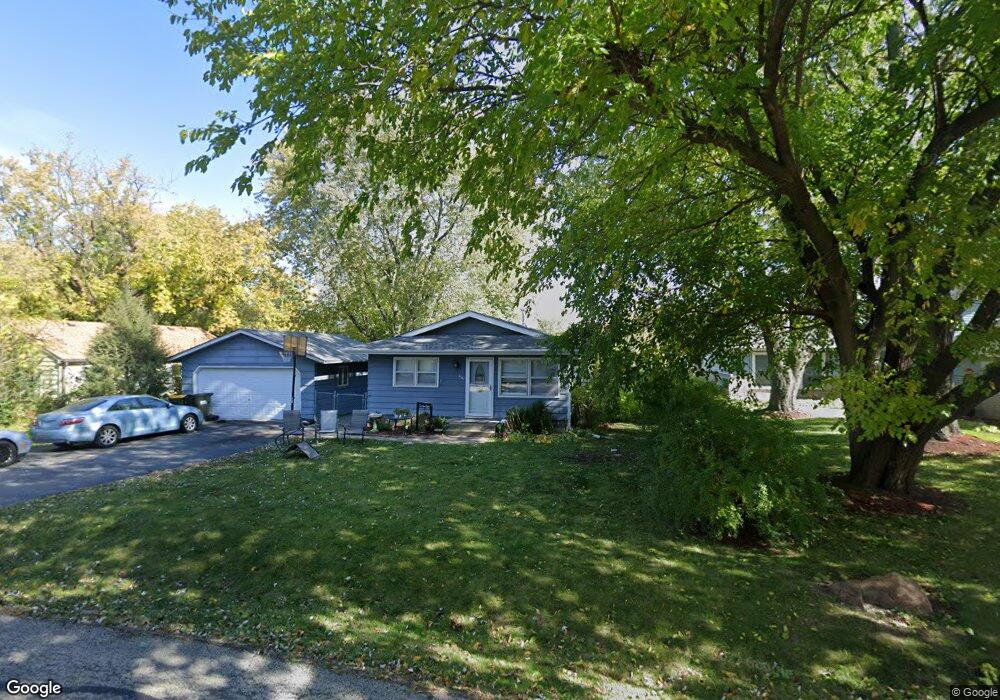
206 Oakleaf Rd Lake In the Hills, IL 60156
Estimated Value: $290,000 - $325,000
3
Beds
2
Baths
1,102
Sq Ft
$277/Sq Ft
Est. Value
About This Home
This home is located at 206 Oakleaf Rd, Lake In the Hills, IL 60156 and is currently estimated at $305,657, approximately $277 per square foot. 206 Oakleaf Rd is a home located in McHenry County with nearby schools including Westfield Community School, Lake in the Hills Elementary School, and United Junior High School.
Ownership History
Date
Name
Owned For
Owner Type
Purchase Details
Closed on
Apr 5, 2017
Sold by
Swedo Michelle M and Chitwood Michelle M Swedo
Bought by
Vanvandyke Bruce Van
Current Estimated Value
Home Financials for this Owner
Home Financials are based on the most recent Mortgage that was taken out on this home.
Original Mortgage
$167,325
Outstanding Balance
$140,773
Interest Rate
4.62%
Mortgage Type
New Conventional
Estimated Equity
$164,884
Purchase Details
Closed on
Oct 9, 2007
Sold by
Hud
Bought by
Guentert Paul
Home Financials for this Owner
Home Financials are based on the most recent Mortgage that was taken out on this home.
Original Mortgage
$137,838
Interest Rate
6.38%
Mortgage Type
FHA
Purchase Details
Closed on
Sep 1, 2006
Sold by
Odonnell
Bought by
Hud
Create a Home Valuation Report for This Property
The Home Valuation Report is an in-depth analysis detailing your home's value as well as a comparison with similar homes in the area
Home Values in the Area
Average Home Value in this Area
Purchase History
| Date | Buyer | Sale Price | Title Company |
|---|---|---|---|
| Vanvandyke Bruce Van | $172,500 | Chicago Title | |
| Guentert Paul | $140,001 | Stewart Title Company | |
| Hud | $136,785 | None Available |
Source: Public Records
Mortgage History
| Date | Status | Borrower | Loan Amount |
|---|---|---|---|
| Open | Vanvandyke Bruce Van | $167,325 | |
| Previous Owner | Guentert Paul | $137,838 |
Source: Public Records
Tax History Compared to Growth
Tax History
| Year | Tax Paid | Tax Assessment Tax Assessment Total Assessment is a certain percentage of the fair market value that is determined by local assessors to be the total taxable value of land and additions on the property. | Land | Improvement |
|---|---|---|---|---|
| 2024 | $5,837 | $81,698 | $10,863 | $70,835 |
| 2023 | $5,530 | $73,069 | $9,716 | $63,353 |
| 2022 | $5,521 | $69,032 | $8,769 | $60,263 |
| 2021 | $5,296 | $64,311 | $8,169 | $56,142 |
| 2020 | $5,158 | $62,035 | $7,880 | $54,155 |
| 2019 | $5,031 | $59,375 | $7,542 | $51,833 |
| 2018 | $4,422 | $51,021 | $14,508 | $36,513 |
| 2017 | $4,187 | $48,065 | $13,667 | $34,398 |
| 2016 | $4,106 | $45,080 | $12,818 | $32,262 |
| 2013 | -- | $44,618 | $11,958 | $32,660 |
Source: Public Records
Map
Nearby Homes
- 113 Pheasant Trail
- 101 Oakleaf Rd
- 212 Village Creek Dr
- 1 Wander Way
- 275 Indian Trail
- 437 Village Creek Dr Unit 20D
- Lots 10 & 11 Ramble Rd
- 135 Arquilla Dr
- 305 Buckingham Dr
- 1114 Ash St
- 1019 Maple St
- 15 W Oak St Unit 5
- 1207 Crystal Lake Rd
- 206 Cool Stone Bend
- LOT 3 Blackhawk Dr
- 541 Blackhawk Dr
- 201 Northlight Passe
- 16 Brian Ct
- 909 Roger St
- 266 Grandview Ct