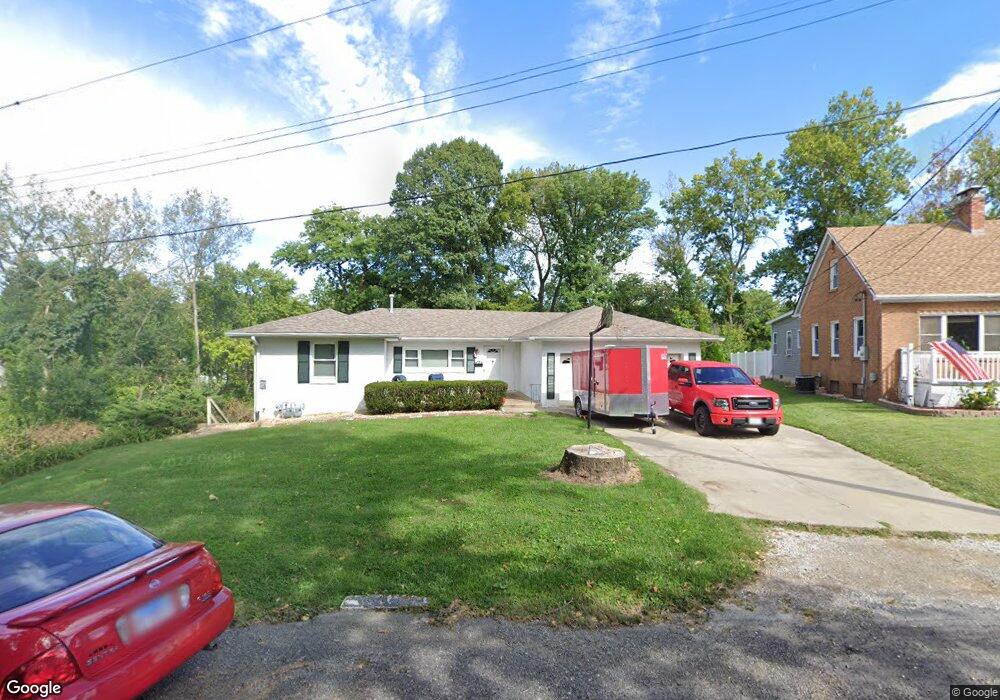
206 Ofarrell St Collinsville, IL 62234
Estimated Value: $177,000 - $215,000
3
Beds
1
Bath
1,168
Sq Ft
$164/Sq Ft
Est. Value
About This Home
This home is located at 206 Ofarrell St, Collinsville, IL 62234 and is currently estimated at $192,079, approximately $164 per square foot. 206 Ofarrell St is a home located in Madison County with nearby schools including Jefferson Elementary School, Dorris Intermediate School, and Collinsville Middle School.
Ownership History
Date
Name
Owned For
Owner Type
Purchase Details
Closed on
Oct 27, 2023
Sold by
Astrauskas Philip J and Astrauskas Mary
Bought by
Nehr Charles E and Nehr Marchie A
Current Estimated Value
Home Financials for this Owner
Home Financials are based on the most recent Mortgage that was taken out on this home.
Original Mortgage
$175,750
Outstanding Balance
$172,302
Interest Rate
6.88%
Mortgage Type
New Conventional
Estimated Equity
$19,777
Purchase Details
Closed on
Mar 9, 2010
Sold by
Us Bank National Association Nd
Bought by
Astrauskas Philip J and Astrauskas Mary
Purchase Details
Closed on
Dec 23, 2009
Sold by
Haller Manuel C
Bought by
Us Bank National Association
Purchase Details
Closed on
Apr 27, 2007
Sold by
Haller Manuel C and Haller Cheryl
Bought by
Haller Manuel C and Haller Cheryl
Home Financials for this Owner
Home Financials are based on the most recent Mortgage that was taken out on this home.
Original Mortgage
$145,000
Interest Rate
8.3%
Mortgage Type
New Conventional
Create a Home Valuation Report for This Property
The Home Valuation Report is an in-depth analysis detailing your home's value as well as a comparison with similar homes in the area
Home Values in the Area
Average Home Value in this Area
Purchase History
| Date | Buyer | Sale Price | Title Company |
|---|---|---|---|
| Nehr Charles E | $185,000 | Abstracts & Titles | |
| Astrauskas Philip J | $61,000 | Fatic | |
| Us Bank National Association | -- | None Available | |
| Haller Manuel C | -- | Integrity Land Title Co Inc |
Source: Public Records
Mortgage History
| Date | Status | Borrower | Loan Amount |
|---|---|---|---|
| Open | Nehr Charles E | $175,750 | |
| Previous Owner | Haller Manuel C | $145,000 |
Source: Public Records
Tax History Compared to Growth
Tax History
| Year | Tax Paid | Tax Assessment Tax Assessment Total Assessment is a certain percentage of the fair market value that is determined by local assessors to be the total taxable value of land and additions on the property. | Land | Improvement |
|---|---|---|---|---|
| 2024 | $3,635 | $56,860 | $7,280 | $49,580 |
| 2023 | $3,635 | $52,060 | $6,630 | $45,430 |
| 2022 | $3,426 | $48,140 | $6,130 | $42,010 |
| 2021 | $3,124 | $45,230 | $5,760 | $39,470 |
| 2020 | $3,013 | $43,160 | $5,500 | $37,660 |
| 2019 | $3,058 | $43,460 | $7,720 | $35,740 |
| 2018 | $2,989 | $41,180 | $7,320 | $33,860 |
| 2017 | $2,995 | $40,360 | $7,170 | $33,190 |
| 2016 | $3,154 | $40,360 | $7,170 | $33,190 |
| 2015 | $3,851 | $39,310 | $6,980 | $32,330 |
| 2014 | $3,851 | $51,450 | $7,410 | $44,040 |
| 2013 | $3,851 | $51,450 | $7,410 | $44,040 |
Source: Public Records
Map
Nearby Homes
- 126 Collinsville Ave
- 205 Audrey Ave
- 108 Westridge Dr
- 101 Westminster Dr
- Lot 32 Jefferson Ave
- 820 Bond Ave
- 710 Saint Louis Rd
- Lot 37 Jefferson Ave
- Lot 38 Jefferson Ave
- 746 Maple St
- Lot 36 Jefferson Ave
- 128 Courtland Place
- 114 Moffett Ave Unit 116
- Lot 20 Jefferson Ave
- 116 Moffett Ave
- 611 W Main St
- 11 Davis Place
- 119 N Hesperia St
- 221 N Hesperia St Unit 221 A and 221 B
- 125 S Hesperia St
- 208 Ofarrell St
- 204 Ofarrell St
- 210 Ofarrell St
- 309 Sycamore St
- 311 Sycamore St
- 305 Sycamore St
- 207 Ofarrell St
- 313 Sycamore St
- 300 Ofarrell St
- 105 Westbrook Ct
- 107 Westbrook Ct
- 315 Sycamore St
- 209 Ofarrell St
- 103 Westbrook Ct
- 319 Sumner Blvd
- 317 Sycamore St
- 303 Ofarrell St
- 101 Westbrook Ct
- 109 Westbrook Ct
- 319 Sycamore St