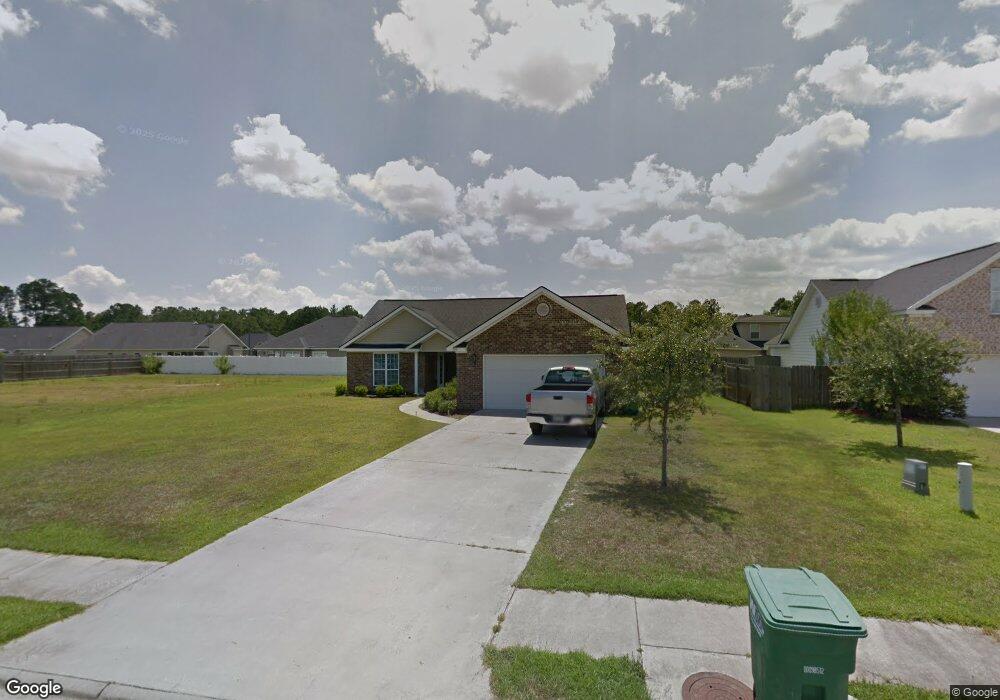
206 Quartz Dr Rincon, GA 31326
Estimated Value: $301,170 - $318,000
3
Beds
2
Baths
1,621
Sq Ft
$192/Sq Ft
Est. Value
About This Home
This home is located at 206 Quartz Dr, Rincon, GA 31326 and is currently estimated at $310,543, approximately $191 per square foot. 206 Quartz Dr is a home located in Effingham County with nearby schools including Blandford Elementary School, Ebenezer Middle School, and Effingham County High School.
Ownership History
Date
Name
Owned For
Owner Type
Purchase Details
Closed on
Sep 21, 2011
Sold by
Federal National Mortgage Association
Bought by
Lane Edward L
Current Estimated Value
Home Financials for this Owner
Home Financials are based on the most recent Mortgage that was taken out on this home.
Original Mortgage
$116,900
Outstanding Balance
$79,622
Interest Rate
4.3%
Mortgage Type
VA
Estimated Equity
$230,921
Purchase Details
Closed on
Jun 7, 2011
Sold by
Jones Segried B and Jones Jerome
Bought by
Citimortgage Inc
Purchase Details
Closed on
Jul 13, 2005
Sold by
Darwin Beasley Construction
Bought by
Jones Sigried B
Home Financials for this Owner
Home Financials are based on the most recent Mortgage that was taken out on this home.
Original Mortgage
$162,370
Interest Rate
5.59%
Mortgage Type
New Conventional
Purchase Details
Closed on
Jan 14, 2005
Sold by
Corr Developments Llc
Bought by
Darwin Beasley Construction In
Create a Home Valuation Report for This Property
The Home Valuation Report is an in-depth analysis detailing your home's value as well as a comparison with similar homes in the area
Home Values in the Area
Average Home Value in this Area
Purchase History
| Date | Buyer | Sale Price | Title Company |
|---|---|---|---|
| Lane Edward L | $116,900 | -- | |
| Citimortgage Inc | $153,300 | -- | |
| Federal National Mortgage Association | -- | -- | |
| Citimortgage Inc | $153,267 | -- | |
| Jones Sigried B | $162,370 | -- | |
| Darwin Beasley Construction In | $35,800 | -- |
Source: Public Records
Mortgage History
| Date | Status | Borrower | Loan Amount |
|---|---|---|---|
| Open | Lane Edward L | $116,900 | |
| Previous Owner | Jones Sigried B | $162,370 |
Source: Public Records
Tax History
| Year | Tax Paid | Tax Assessment Tax Assessment Total Assessment is a certain percentage of the fair market value that is determined by local assessors to be the total taxable value of land and additions on the property. | Land | Improvement |
|---|---|---|---|---|
| 2025 | -- | $108,186 | $22,800 | $85,386 |
| 2024 | -- | $109,951 | $22,800 | $87,151 |
| 2023 | -- | $89,370 | $17,600 | $71,770 |
| 2022 | $2,073 | $78,716 | $17,600 | $61,116 |
| 2021 | $1,888 | $70,601 | $14,000 | $56,601 |
| 2020 | $1,898 | $65,184 | $12,000 | $53,184 |
| 2019 | $1,799 | $62,784 | $12,000 | $50,784 |
| 2018 | $1,723 | $61,656 | $10,000 | $51,656 |
| 2017 | $1,677 | $59,115 | $10,000 | $49,115 |
| 2016 | -- | $52,396 | $8,000 | $44,396 |
| 2015 | -- | $55,953 | $7,200 | $48,753 |
| 2014 | -- | $58,353 | $9,600 | $48,753 |
| 2013 | -- | $42,842 | $3,840 | $39,002 |
Source: Public Records
Map
Nearby Homes
- 211 Quartz Dr
- 107 Stonewalk Dr
- 114 Stonewalk Dr
- 219 Jasper Ln
- 112 Karima Cir
- 124 Tolliver Ln
- 201 Bailee Ave
- 225 Jasper Ln
- 105 Saint Andrews Rd
- 100 Spillway Ct
- 233 Jasper Ln
- 10 Michelle Ct
- 136 Fraser Ln
- 235 Saint Andrews Rd
- 208 Market St
- 515 Weisenbaker Rd
- 417 Keiffer Dr
- 414 Roberts Way
- 411 Plantation Place
- 317 St Andrews Rd
- 204 Quartz Dr
- 208 Quartz Dr
- 109 Stonewalk Dr
- 105 Stonewalk Dr
- 210 Quartz Dr
- 202 Quartz Dr
- 207 Quartz Dr
- 209 Quartz Dr
- 205 Quartz Dr
- 103 Stonewalk Dr
- 111 Stonewalk Dr
- 203 Quartz Dr
- 212 Quartz Dr
- 200 Quartz Dr
- 101 Stonewalk Dr
- 306 Pebble Dr
- 106 Stonewalk Dr
- 308 Pebble Dr
- 304 Pebble Dr
- 104 Stonewalk Dr
Your Personal Tour Guide
Ask me questions while you tour the home.