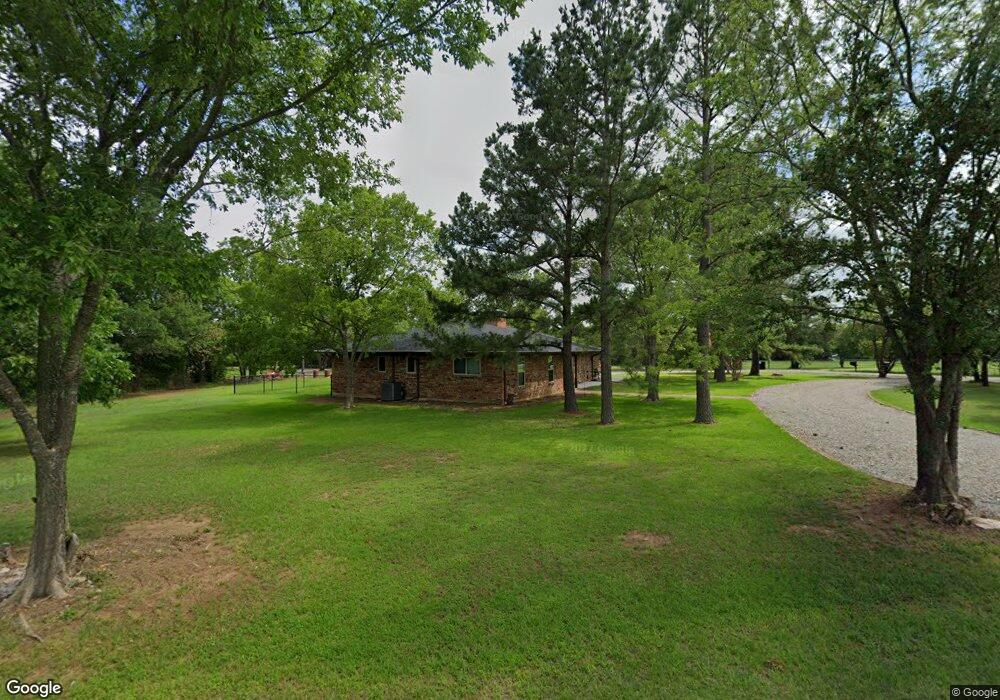
206 Rawhide Trail Denison, TX 75021
Estimated Value: $352,000 - $370,467
3
Beds
2
Baths
2,000
Sq Ft
$181/Sq Ft
Est. Value
About This Home
This home is located at 206 Rawhide Trail, Denison, TX 75021 and is currently estimated at $361,234, approximately $180 per square foot. 206 Rawhide Trail is a home located in Grayson County with nearby schools including Lamar Elementary School, Scott Middle School, and Denison High School.
Ownership History
Date
Name
Owned For
Owner Type
Purchase Details
Closed on
Feb 16, 2021
Sold by
Thomason Gary Carter and Thomason Karen L
Bought by
Wuebker Cindi Lynne and Wuebker Curtis James
Current Estimated Value
Home Financials for this Owner
Home Financials are based on the most recent Mortgage that was taken out on this home.
Original Mortgage
$264,575
Outstanding Balance
$236,428
Interest Rate
2.65%
Mortgage Type
New Conventional
Estimated Equity
$124,806
Purchase Details
Closed on
Jun 5, 2020
Sold by
Spath Constance
Bought by
Thomason Gary Carter and Thomason Karen L
Home Financials for this Owner
Home Financials are based on the most recent Mortgage that was taken out on this home.
Original Mortgage
$147,550
Interest Rate
3.2%
Mortgage Type
New Conventional
Create a Home Valuation Report for This Property
The Home Valuation Report is an in-depth analysis detailing your home's value as well as a comparison with similar homes in the area
Home Values in the Area
Average Home Value in this Area
Purchase History
| Date | Buyer | Sale Price | Title Company |
|---|---|---|---|
| Wuebker Cindi Lynne | -- | None Available | |
| Thomason Gary Carter | -- | First American Mortgage Sln |
Source: Public Records
Mortgage History
| Date | Status | Borrower | Loan Amount |
|---|---|---|---|
| Open | Wuebker Cindi Lynne | $264,575 | |
| Previous Owner | Thomason Gary Carter | $147,550 |
Source: Public Records
Tax History
| Year | Tax Paid | Tax Assessment Tax Assessment Total Assessment is a certain percentage of the fair market value that is determined by local assessors to be the total taxable value of land and additions on the property. | Land | Improvement |
|---|---|---|---|---|
| 2025 | $5,391 | $362,473 | $205,947 | $156,526 |
| 2024 | $5,391 | $333,820 | $173,192 | $160,628 |
| 2023 | $5,688 | $351,723 | $185,771 | $165,952 |
| 2022 | $5,404 | $312,749 | $142,818 | $169,931 |
| 2021 | $4,328 | $230,874 | $89,395 | $141,479 |
| 2020 | $4,015 | $201,667 | $55,867 | $145,800 |
| 2019 | $4,293 | $202,157 | $55,867 | $146,290 |
| 2018 | $3,995 | $186,117 | $55,867 | $130,250 |
| 2017 | $3,714 | $171,931 | $48,454 | $123,477 |
| 2016 | $3,624 | $167,730 | $38,226 | $129,504 |
Source: Public Records
Map
Nearby Homes
- 199 Chaparral Estates Dr
- 21 Chaparral Estates Dr
- TBD N Highway 69
- 230 Frosty Hollow Rd
- 246 Karen Dr
- TBD Johnson Rd
- 413 Rolling Acres Rd
- 1382 US Highway 69
- 1747 Desvoignes Rd
- TBD Cross Timber Estates Dr
- 66 Shady Woods Ln
- 40 Cumberland Cir
- 124 Mark Dr
- 125 Mark Dr
- 492 Richerson Rd
- 785 Trail Rd
- 732 E Bullock St
- 721 E Bullock St
- 1800 S Center St
- 705 E Hanna St
- 161 Rawhide Trail
- 193 Rawhide Trail
- 101 Rawhide Trail
- 290 Rawhide Trail
- 179 Rawhide Trail
- 308 Rawhide Trail
- 267 Rawhide Trail
- 41 Rawhide Trail
- 147 Tumbleweed Trail
- 418 Lariat Dr
- 311 Rawhide Trail
- 187 Tumbleweed Trail
- 454 Lariat Dr
- 297 Rawhide Trail
- 49 Tumbleweed Trail
- 433 Lariat Dr
- 280 Lariat Dr
- 267 Tumbleweed Trail
- 202 Tumbleweed Trail
- 110 Tumbleweed Trail
Your Personal Tour Guide
Ask me questions while you tour the home.