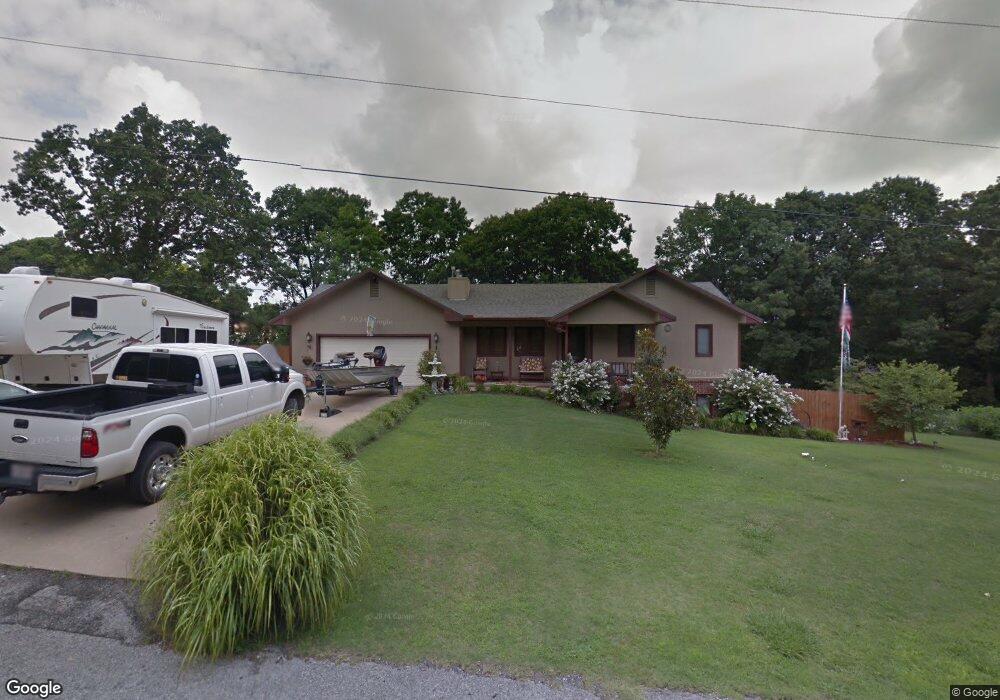
206 Redbud Ln NE Gravette, AR 72736
Estimated Value: $322,000 - $366,000
--
Bed
3
Baths
1,184
Sq Ft
$289/Sq Ft
Est. Value
About This Home
This home is located at 206 Redbud Ln NE, Gravette, AR 72736 and is currently estimated at $341,968, approximately $288 per square foot. 206 Redbud Ln NE is a home located in Benton County with nearby schools including Glenn Duffy Elementary School, Gravette Upper Elementary School, and Gravette Middle School.
Ownership History
Date
Name
Owned For
Owner Type
Purchase Details
Closed on
Nov 10, 2003
Bought by
Prudent
Current Estimated Value
Purchase Details
Closed on
Oct 8, 2003
Bought by
Garland
Purchase Details
Closed on
Jul 31, 1997
Bought by
Prudent Inc
Purchase Details
Closed on
Jul 11, 1997
Bought by
Evergreen Bldrs
Purchase Details
Closed on
Jun 30, 1997
Bought by
Adv One Mtg
Purchase Details
Closed on
Jun 24, 1997
Bought by
Evergreen Bldrs
Purchase Details
Closed on
Apr 25, 1997
Bought by
Advantage One
Purchase Details
Closed on
Aug 3, 1995
Bought by
Mark W Corley
Purchase Details
Closed on
Jul 8, 1993
Bought by
Evergreen Builders
Purchase Details
Closed on
May 7, 1993
Bought by
Ritz
Purchase Details
Closed on
May 12, 1989
Bought by
1St Nat'L Bank
Create a Home Valuation Report for This Property
The Home Valuation Report is an in-depth analysis detailing your home's value as well as a comparison with similar homes in the area
Home Values in the Area
Average Home Value in this Area
Purchase History
| Date | Buyer | Sale Price | Title Company |
|---|---|---|---|
| Prudent | -- | -- | |
| Garland | $125,000 | -- | |
| Prudent Inc | $107,000 | -- | |
| Evergreen Bldrs | -- | -- | |
| Ritz | -- | -- | |
| Adv One Mtg | -- | -- | |
| Evergreen Bldrs | -- | -- | |
| Ritz 8Lts | -- | -- | |
| Advantage One | -- | -- | |
| Mark W Corley | -- | -- | |
| Evergreen Builders | $5,000 | -- | |
| Ritz | $18,000 | -- | |
| 1St Nat'L Bank | -- | -- |
Source: Public Records
Tax History Compared to Growth
Tax History
| Year | Tax Paid | Tax Assessment Tax Assessment Total Assessment is a certain percentage of the fair market value that is determined by local assessors to be the total taxable value of land and additions on the property. | Land | Improvement |
|---|---|---|---|---|
| 2025 | $2,547 | $58,389 | $5,936 | $52,453 |
| 2024 | $2,286 | $58,389 | $5,936 | $52,453 |
| 2023 | $2,078 | $42,430 | $3,600 | $38,830 |
| 2022 | $2,014 | $42,430 | $3,600 | $38,830 |
| 2021 | $1,830 | $42,430 | $3,600 | $38,830 |
| 2020 | $1,305 | $34,520 | $1,910 | $32,610 |
| 2019 | $1,237 | $34,520 | $1,910 | $32,610 |
| 2018 | $1,195 | $34,520 | $1,910 | $32,610 |
| 2017 | $993 | $34,520 | $1,910 | $32,610 |
| 2016 | $993 | $34,520 | $1,910 | $32,610 |
| 2015 | $1,286 | $26,080 | $2,000 | $24,080 |
| 2014 | $936 | $26,080 | $2,000 | $24,080 |
Source: Public Records
Map
Nearby Homes
- 207 White Oak Dr NE
- 108 Boston St NE
- 0 Arkansas 72
- 105 4th Ave SE
- 802 & 804 NW Baker St
- 806 & 808 NW Baker St
- 111 5th Ave SW
- 1111 Rocky Dell Rd NE
- 505 Birmingham St SE
- 608 Birmingham St SE
- 0 Ridge Rd Unit 1318172
- 1001 Main St SE
- 408 Lion Dr N
- 0 SW Dallas St
- 508 2nd Ave SW
- 515 2nd Ave SW
- 101 Nelson Park Rd SW
- 105 Nelson Park Rd SW
- 704 2nd Ave SW
- 13812 Sunburst Ln
- 0 Redbud Ln
- 205 White Oak Dr NE Unit D
- 205 White Oak Dr NE Unit C
- 205 White Oak Dr NE
- 201 Redbud Ln NE
- 1060 1st Ave NE
- 204 White Oak Dr NE
- 207 White Oak Dr NE Unit A-D
- 206 White Oak Dr NE
- 202 White Oak Dr NE Unit A&B
- 202 White Oak Dr NE
- 202 White Oak Dr NE Unit A
- 202 White Oak Dr NE Unit B
- 208 Redbud Ln NE
- 208 & 210 NE White Oak
- 208 White Oak Dr NE
- 702 1st Ave NE
- 209 White Oak Dr NE
- 210 White Oak Dr NE Unit a,b, & c
- 210 White Oak Dr NE