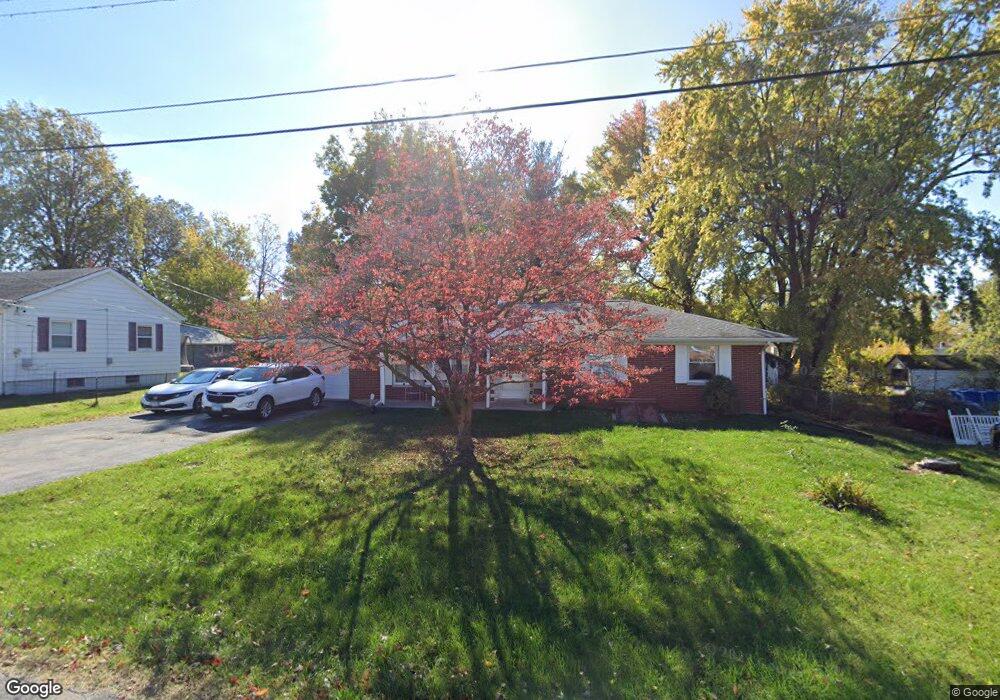
206 S 2nd St O Fallon, IL 62269
Estimated Value: $183,000 - $247,000
Studio
--
Bath
1,380
Sq Ft
$151/Sq Ft
Est. Value
About This Home
This home is located at 206 S 2nd St, O Fallon, IL 62269 and is currently estimated at $208,626, approximately $151 per square foot. 206 S 2nd St is a home located in St. Clair County with nearby schools including Shiloh Elementary School, Shiloh Middle School, and O'Fallon Township High School.
Ownership History
Date
Name
Owned For
Owner Type
Purchase Details
Closed on
Aug 29, 2022
Sold by
Picchietti Robert and Picchietti Andrea
Bought by
Picchietti Real Estate Holdings Inc
Current Estimated Value
Purchase Details
Closed on
May 3, 2019
Sold by
Mcmanus Thomas and Mcmanus Mary
Bought by
Picchietti Robert and Picchietti Andrea
Home Financials for this Owner
Home Financials are based on the most recent Mortgage that was taken out on this home.
Original Mortgage
$118,150
Interest Rate
4.75%
Mortgage Type
Commercial
Purchase Details
Closed on
May 31, 2013
Sold by
Pelland Patrick V and Pelland Carol
Bought by
Mcmanus Thomas and Mcmanus Mary
Home Financials for this Owner
Home Financials are based on the most recent Mortgage that was taken out on this home.
Original Mortgage
$82,176
Interest Rate
4%
Mortgage Type
New Conventional
Create a Home Valuation Report for This Property
The Home Valuation Report is an in-depth analysis detailing your home's value as well as a comparison with similar homes in the area
Home Values in the Area
Average Home Value in this Area
Purchase History
| Date | Buyer | Sale Price | Title Company |
|---|---|---|---|
| Picchietti Real Estate Holdings Inc | -- | Community Title | |
| Picchietti Robert | $118,000 | Community Title Shiloh Llc | |
| Mcmanus Thomas | $103,000 | Community Title Shiloh Llc |
Source: Public Records
Mortgage History
| Date | Status | Borrower | Loan Amount |
|---|---|---|---|
| Previous Owner | Picchietti Robert | $118,150 | |
| Previous Owner | Mcmanus Thomas | $82,176 |
Source: Public Records
Tax History
| Year | Tax Paid | Tax Assessment Tax Assessment Total Assessment is a certain percentage of the fair market value that is determined by local assessors to be the total taxable value of land and additions on the property. | Land | Improvement |
|---|---|---|---|---|
| 2024 | $4,609 | $62,171 | $6,544 | $55,627 |
| 2023 | $3,656 | $48,198 | $6,352 | $41,846 |
| 2022 | $3,511 | $44,894 | $5,917 | $38,977 |
| 2021 | $3,280 | $42,217 | $5,564 | $36,653 |
| 2020 | $3,385 | $39,844 | $5,251 | $34,593 |
| 2019 | $3,396 | $40,701 | $5,454 | $35,247 |
| 2018 | $3,338 | $39,538 | $5,298 | $34,240 |
| 2017 | $3,239 | $37,682 | $5,050 | $32,632 |
| 2016 | $3,216 | $36,965 | $4,954 | $32,011 |
| 2014 | $3,115 | $38,813 | $6,292 | $32,521 |
| 2013 | $2,289 | $39,336 | $6,377 | $32,959 |
Source: Public Records
Map
Nearby Homes
- 4132 Lebanon Ave
- 3830 Breezy Hill
- 3745 Thicket Dr
- 409 Sage Dr
- 3719 Thicket Dr
- 1606 Fairway Dr
- 500 Master Ct
- 3736 Osprey Ct
- 3714 Thicket Dr
- 3740 Golfview Cir
- 3736 Golfview Cir
- 3706 Thicket Dr
- 433 Briarberry Dr
- 3716 Osprey Ct
- 3704 Osprey Ct
- 3700 Osprey Ct
- 3518 Capri Ln
- 109 Eagles Landing Dr
- 3536 Harbor Way
- 10 Phillips Ln
- 202 S 2nd St
- 210 S 2nd St
- 417 Timberline Ct
- 214 S 2nd St
- 413 Timberline Ct
- 421 Timberline Ct
- 217 East St
- 114 S 2nd St
- 425 Timberline Ct
- 409 Timberline Ct
- 218 S 2nd St
- 213 East St
- 429 Timberline Ct
- 405 Timberline Ct
- 416 Timberline Ct
- 412 Timberline Ct
- 217 S 2nd St
- 420 Timberline Ct
- 222 S 2nd St
- 433 Timberline Ct
Your Personal Tour Guide
Ask me questions while you tour the home.