Estimated Value: $182,863 - $242,000
Studio
2
Baths
2,050
Sq Ft
$101/Sq Ft
Est. Value
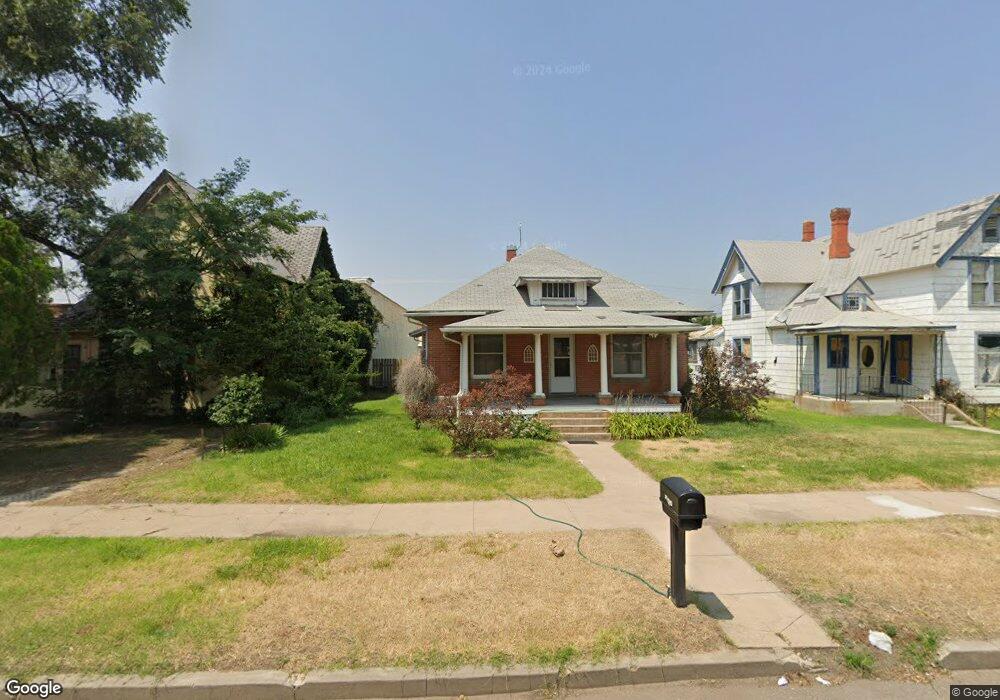
About This Home
This home is located at 206 S 3rd St, Lamar, CO 81052 and is currently estimated at $206,966, approximately $100 per square foot. 206 S 3rd St is a home located in Prowers County with nearby schools including Washington Elementary School, Parkview Elementary School, and Lamar Middle School.
Ownership History
Date
Name
Owned For
Owner Type
Purchase Details
Closed on
Mar 31, 2022
Sold by
Ratcliff Jason D
Bought by
Ratcliff Jason Dwayne and Rider Jerie Kay
Current Estimated Value
Purchase Details
Closed on
Feb 20, 2007
Sold by
Fannie Mae
Bought by
Rider Jerie
Home Financials for this Owner
Home Financials are based on the most recent Mortgage that was taken out on this home.
Original Mortgage
$19,011
Interest Rate
6.17%
Mortgage Type
Purchase Money Mortgage
Purchase Details
Closed on
Dec 26, 2006
Sold by
Stinson Elmer J
Bought by
Federal National Mortgage Association
Home Financials for this Owner
Home Financials are based on the most recent Mortgage that was taken out on this home.
Original Mortgage
$19,011
Interest Rate
6.17%
Mortgage Type
Purchase Money Mortgage
Purchase Details
Closed on
Dec 18, 2002
Sold by
Burnett Jimmie K and Ellenberger Helen E
Bought by
Stinson Elmer J
Purchase Details
Closed on
Aug 18, 1983
Sold by
Warn Eldora J and Warn Emma May
Bought by
Burnett Jimmie K
Create a Home Valuation Report for This Property
The Home Valuation Report is an in-depth analysis detailing your home's value as well as a comparison with similar homes in the area
Home Values in the Area
Average Home Value in this Area
Purchase History
| Date | Buyer | Sale Price | Title Company |
|---|---|---|---|
| Ratcliff Jason Dwayne | -- | None Listed On Document | |
| Rider Jerie | $23,000 | Security Title | |
| Federal National Mortgage Association | -- | None Available | |
| Stinson Elmer J | $56,000 | -- | |
| Burnett Jimmie K | $19,830,800 | -- |
Source: Public Records
Mortgage History
| Date | Status | Borrower | Loan Amount |
|---|---|---|---|
| Previous Owner | Rider Jerie | $19,011 |
Source: Public Records
Tax History
| Year | Tax Paid | Tax Assessment Tax Assessment Total Assessment is a certain percentage of the fair market value that is determined by local assessors to be the total taxable value of land and additions on the property. | Land | Improvement |
|---|---|---|---|---|
| 2025 | $369 | $0 | $0 | $0 |
| 2024 | $369 | $0 | $0 | $0 |
| 2023 | $94 | $34,408 | $2,135 | $32,273 |
| 2022 | $338 | $34,408 | $2,135 | $32,273 |
| 2021 | $342 | $5,478 | $340 | $5,138 |
| 2020 | $233 | $3,768 | $340 | $3,428 |
| 2019 | $233 | $3,385 | $305 | $3,080 |
| 2018 | $159 | $2,298 | $393 | $1,905 |
| 2017 | $150 | $2,298 | $393 | $1,905 |
| 2016 | $212 | $3,257 | $435 | $2,822 |
| 2015 | $212 | $3,257 | $435 | $2,822 |
| 2014 | $231 | $3,537 | $435 | $3,102 |
Source: Public Records
Map
Nearby Homes
Your Personal Tour Guide
Ask me questions while you tour the home.