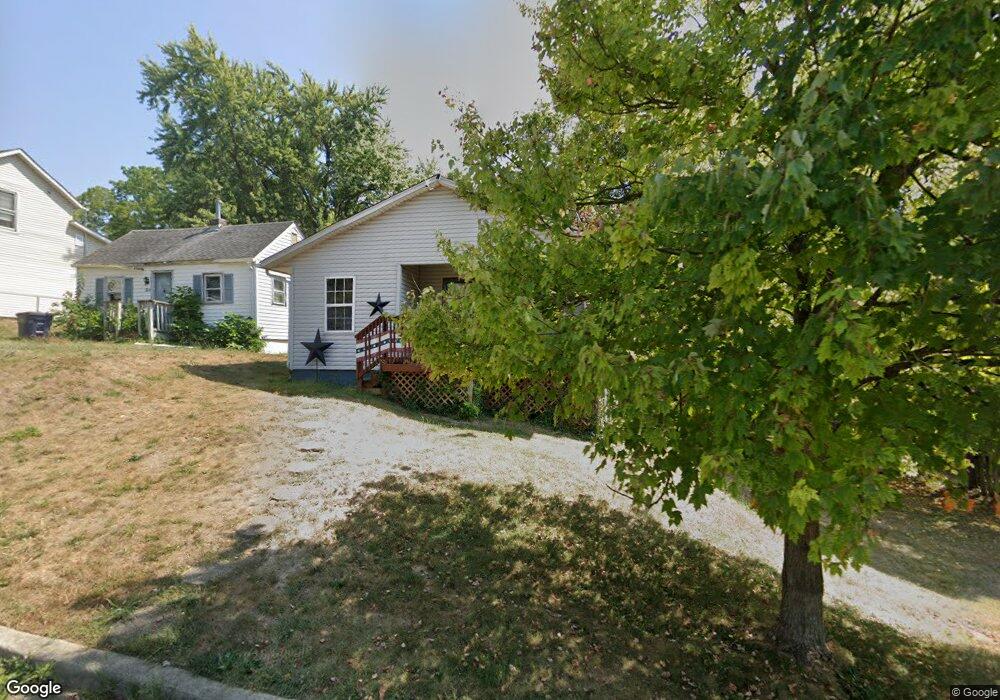
206 S Cedar Ave Lancaster, OH 43130
Estimated Value: $135,000 - $202,000
3
Beds
1
Bath
981
Sq Ft
$183/Sq Ft
Est. Value
About This Home
This home is located at 206 S Cedar Ave, Lancaster, OH 43130 and is currently estimated at $179,319, approximately $182 per square foot. 206 S Cedar Ave is a home located in Fairfield County with nearby schools including General Sherman Junior High School, Lancaster High School, and St Mary Elementary School.
Ownership History
Date
Name
Owned For
Owner Type
Purchase Details
Closed on
Feb 23, 2000
Sold by
Habitat For Humanity Of
Bought by
Montgomery Edison R Vicki A
Current Estimated Value
Home Financials for this Owner
Home Financials are based on the most recent Mortgage that was taken out on this home.
Original Mortgage
$75,850
Outstanding Balance
$23,567
Interest Rate
8.21%
Mortgage Type
FHA
Estimated Equity
$155,752
Purchase Details
Closed on
Jun 8, 1994
Sold by
Habitat For Humanity
Bought by
Findley Ron A and Findley Robyn C
Home Financials for this Owner
Home Financials are based on the most recent Mortgage that was taken out on this home.
Original Mortgage
$34,485
Interest Rate
8.45%
Mortgage Type
New Conventional
Purchase Details
Closed on
Mar 25, 1993
Sold by
Amerine Thomas B
Bought by
Habitat For Humanty
Purchase Details
Closed on
Feb 1, 1988
Create a Home Valuation Report for This Property
The Home Valuation Report is an in-depth analysis detailing your home's value as well as a comparison with similar homes in the area
Home Values in the Area
Average Home Value in this Area
Purchase History
| Date | Buyer | Sale Price | Title Company |
|---|---|---|---|
| Montgomery Edison R Vicki A | $75,900 | -- | |
| Findley Ron A | $60,000 | -- | |
| Habitat For Humanty | $4,000 | -- | |
| -- | $1,000 | -- |
Source: Public Records
Mortgage History
| Date | Status | Borrower | Loan Amount |
|---|---|---|---|
| Open | Montgomery Edison R Vicki A | $75,850 | |
| Previous Owner | Findley Ron A | $34,485 |
Source: Public Records
Tax History
| Year | Tax Paid | Tax Assessment Tax Assessment Total Assessment is a certain percentage of the fair market value that is determined by local assessors to be the total taxable value of land and additions on the property. | Land | Improvement |
|---|---|---|---|---|
| 2025 | $3,909 | $56,440 | $10,860 | $45,580 |
| 2024 | $3,909 | $43,480 | $7,200 | $36,280 |
| 2023 | $1,581 | $43,480 | $7,200 | $36,280 |
| 2022 | $1,588 | $43,480 | $7,200 | $36,280 |
| 2021 | $1,186 | $30,420 | $5,570 | $24,850 |
| 2020 | $1,136 | $30,420 | $5,570 | $24,850 |
| 2019 | $1,080 | $30,420 | $5,570 | $24,850 |
| 2018 | $907 | $25,530 | $5,570 | $19,960 |
| 2017 | $907 | $24,260 | $5,300 | $18,960 |
| 2016 | $884 | $24,260 | $5,300 | $18,960 |
| 2015 | $914 | $24,350 | $5,300 | $19,050 |
| 2014 | $871 | $24,350 | $5,300 | $19,050 |
| 2013 | $871 | $24,350 | $5,300 | $19,050 |
Source: Public Records
Map
Nearby Homes
- 114-116 S Cedar Ave
- 1414 Cedar Hill Rd
- 1511 Cedar Hill Rd
- 219 Peters Ave
- 104 S Pierce Ave
- 132 N Pierce Ave
- 215 Summitview Dr
- 157 Cedar Hill Rd
- 302 Washington Ave
- 757 W Mulberry St
- 738 Maryland Ave
- 772 Pennsylvania Ave
- 1829 Shoshone Dr
- 729 Pennsylvania Ave
- 453 Bren Dr
- 507 Washington Ave
- 539 N Ohio Ave
- 520 W Wheeling St
- 461 N Shoshone Dr
- 113 N George St
- 204 S Cedar Ave
- 208 S Cedar Ave
- 200 S Cedar Ave
- 150 S Cedar Ave
- 150 S Cedar Ave
- 220 S Cedar Ave
- 221 S Baker Ave
- 201 S Baker Ave
- 205 S Cedar Ave
- 213 S Cedar Ave
- 146 S Cedar Ave
- 201 S Cedar Ave
- 0 Cedar Ave
- 217 S Cedar Ave
- 147 S Baker Ave
- 227 S Baker Ave
- 227 S Baker Ave
- 151 S Cedar Ave
- 221 S Cedar Ave
- 142 S Cedar Ave
Your Personal Tour Guide
Ask me questions while you tour the home.