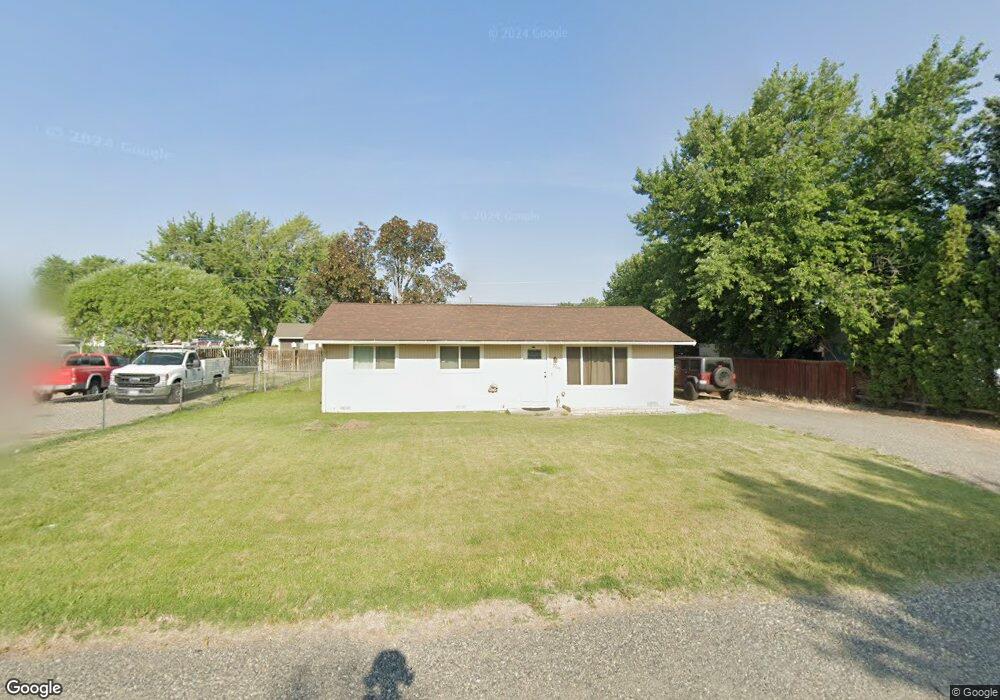
206 S Olson St Unit Home has totally bee Kennewick, WA 99336
Estimated Value: $311,000 - $331,000
3
Beds
1
Bath
1,062
Sq Ft
$299/Sq Ft
Est. Value
About This Home
This home is located at 206 S Olson St Unit Home has totally bee, Kennewick, WA 99336 and is currently estimated at $317,403, approximately $298 per square foot. 206 S Olson St Unit Home has totally bee is a home located in Benton County with nearby schools including Edison Elementary School, Highlands Middle School, and Southridge High School.
Ownership History
Date
Name
Owned For
Owner Type
Purchase Details
Closed on
Sep 26, 2019
Sold by
Nero Frank J and Nero Diane M
Bought by
Escamilla Federico
Current Estimated Value
Home Financials for this Owner
Home Financials are based on the most recent Mortgage that was taken out on this home.
Original Mortgage
$194,000
Outstanding Balance
$170,300
Interest Rate
3.6%
Mortgage Type
New Conventional
Estimated Equity
$147,103
Purchase Details
Closed on
Nov 6, 2014
Sold by
Brock James and Brock Stephanie
Bought by
Kogelman Amy Jean and Nero Frank J
Home Financials for this Owner
Home Financials are based on the most recent Mortgage that was taken out on this home.
Original Mortgage
$132,456
Interest Rate
3.87%
Mortgage Type
FHA
Purchase Details
Closed on
Nov 7, 2013
Sold by
Daves Nelda G and Daves Nelda Grace
Bought by
Brock James and Brock Stephanie
Create a Home Valuation Report for This Property
The Home Valuation Report is an in-depth analysis detailing your home's value as well as a comparison with similar homes in the area
Home Values in the Area
Average Home Value in this Area
Purchase History
| Date | Buyer | Sale Price | Title Company |
|---|---|---|---|
| Escamilla Federico | $232,680 | Ticor Title Company | |
| Kogelman Amy Jean | $134,900 | Columbia Title Co | |
| Brock James | $77,000 | Marshall Title Co |
Source: Public Records
Mortgage History
| Date | Status | Borrower | Loan Amount |
|---|---|---|---|
| Open | Escamilla Federico | $194,000 | |
| Previous Owner | Kogelman Amy Jean | $132,456 |
Source: Public Records
Tax History Compared to Growth
Tax History
| Year | Tax Paid | Tax Assessment Tax Assessment Total Assessment is a certain percentage of the fair market value that is determined by local assessors to be the total taxable value of land and additions on the property. | Land | Improvement |
|---|---|---|---|---|
| 2024 | $2,047 | $287,170 | $70,000 | $217,170 |
| 2023 | $2,047 | $253,760 | $70,000 | $183,760 |
| 2022 | $1,896 | $214,780 | $70,000 | $144,780 |
| 2021 | $1,512 | $192,510 | $70,000 | $122,510 |
| 2020 | $1,461 | $148,310 | $32,000 | $116,310 |
| 2019 | $1,275 | $137,060 | $32,000 | $105,060 |
| 2018 | $1,365 | $122,050 | $32,000 | $90,050 |
| 2017 | $1,242 | $107,040 | $32,000 | $75,040 |
| 2016 | $1,547 | $107,040 | $32,000 | $75,040 |
| 2015 | $1,395 | $107,040 | $32,000 | $75,040 |
| 2014 | -- | $94,000 | $27,500 | $66,500 |
| 2013 | -- | $94,000 | $27,500 | $66,500 |
Source: Public Records
Map
Nearby Homes
- 322 S Ledbetter St
- 149 S Tweedt Place
- 3500 W 6th Place Unit Lot18
- 3416 W 6th Place
- 577 S Quillan Place
- 509 S Johnson St
- 604 S Huntington Place
- 3826 W Grand Ronde Ave
- 2900 W 4th Ave
- 521 N Reed St
- 943 S Keller St
- 2906 W 7th Ave Unit 74
- 3121 W Hood Ave Unit E103
- 115 S Ely St
- 417 S Arthur Place
- 632 N Perry Loop
- 3572 S 11th Place
- 3303 W Imnaha Ave
- 414 S Dennis St
- 3527 W 6th Place Unit Lot 5
- 206 S Olson St Unit Fantastic Price!
- 206 S Olson St
- 204 S Olson St
- 210 S Olson St
- 213 S Perry Place
- 209 S Perry Place
- 207 S Olson St
- 3705 W 2nd Ave
- 219 S Perry Place
- 209 S Olson St
- 3710 W 2nd Ave
- 3708 W 2nd Ave
- 3921 W 2nd Ave
- 3912 W 3rd Ave
- 111 S Quillan St
- 307 S Perry Place
- 215 S Olson St
- 220 S Olson St
- 3702 W 2nd Ave Unit 4
- 204 S Neel St