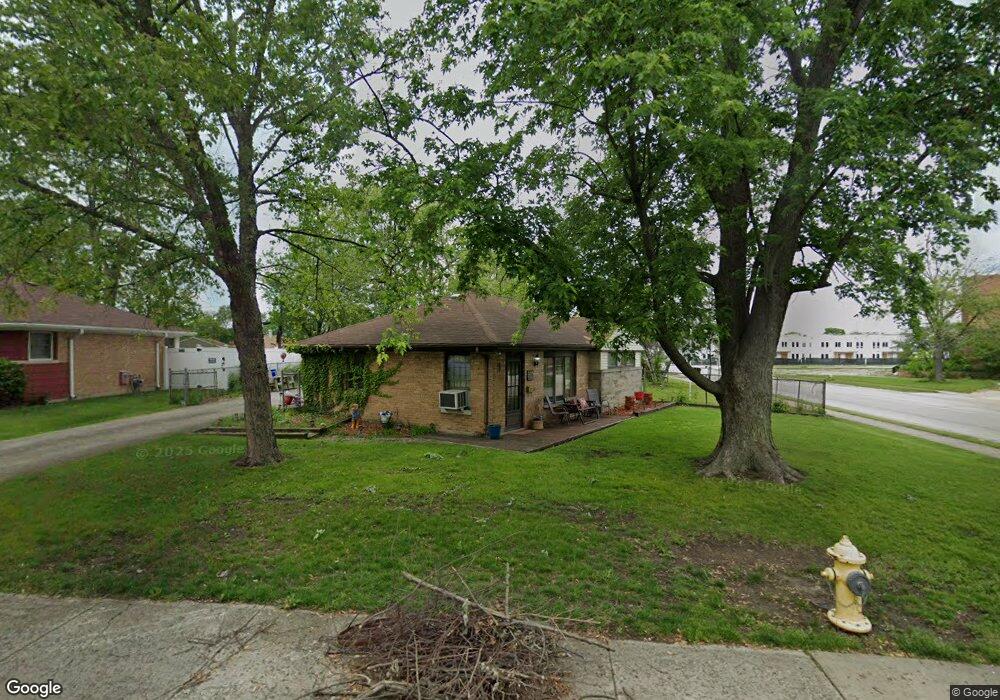
206 S Orchard Dr Park Forest, IL 60466
Estimated Value: $147,408 - $162,000
2
Beds
1
Bath
975
Sq Ft
$157/Sq Ft
Est. Value
About This Home
This home is located at 206 S Orchard Dr, Park Forest, IL 60466 and is currently estimated at $152,602, approximately $156 per square foot. 206 S Orchard Dr is a home located in Cook County with nearby schools including 21st Century Primary Center, Blackhawk Intermediate Center, and Michelle Obama School of Technology.
Ownership History
Date
Name
Owned For
Owner Type
Purchase Details
Closed on
May 15, 2007
Sold by
Heng Nathan and Heng Megan
Bought by
Tennicott James C
Current Estimated Value
Home Financials for this Owner
Home Financials are based on the most recent Mortgage that was taken out on this home.
Original Mortgage
$110,000
Outstanding Balance
$67,274
Interest Rate
6.27%
Mortgage Type
Unknown
Estimated Equity
$85,328
Purchase Details
Closed on
Apr 16, 2004
Sold by
Kenny Paul D
Bought by
Heng Nathan A and Heng Megan
Home Financials for this Owner
Home Financials are based on the most recent Mortgage that was taken out on this home.
Original Mortgage
$86,450
Interest Rate
5.46%
Mortgage Type
Unknown
Purchase Details
Closed on
Jul 21, 2000
Sold by
Sukis Michael E and Sukis Mary Beth
Bought by
Kenny Paul D
Home Financials for this Owner
Home Financials are based on the most recent Mortgage that was taken out on this home.
Original Mortgage
$64,000
Interest Rate
8.27%
Create a Home Valuation Report for This Property
The Home Valuation Report is an in-depth analysis detailing your home's value as well as a comparison with similar homes in the area
Home Values in the Area
Average Home Value in this Area
Purchase History
| Date | Buyer | Sale Price | Title Company |
|---|---|---|---|
| Tennicott James C | $110,000 | None Available | |
| Heng Nathan A | $91,000 | -- | |
| Kenny Paul D | $78,000 | -- |
Source: Public Records
Mortgage History
| Date | Status | Borrower | Loan Amount |
|---|---|---|---|
| Open | Tennicott James C | $110,000 | |
| Previous Owner | Heng Nathan A | $86,450 | |
| Previous Owner | Kenny Paul D | $64,000 |
Source: Public Records
Tax History Compared to Growth
Tax History
| Year | Tax Paid | Tax Assessment Tax Assessment Total Assessment is a certain percentage of the fair market value that is determined by local assessors to be the total taxable value of land and additions on the property. | Land | Improvement |
|---|---|---|---|---|
| 2024 | $6,357 | $12,000 | $3,511 | $8,489 |
| 2023 | $3,217 | $12,000 | $3,511 | $8,489 |
| 2022 | $3,217 | $5,814 | $3,260 | $2,554 |
| 2021 | $3,276 | $5,813 | $3,260 | $2,553 |
| 2020 | $3,261 | $5,813 | $3,260 | $2,553 |
| 2019 | $3,108 | $6,285 | $3,009 | $3,276 |
| 2018 | $2,989 | $6,285 | $3,009 | $3,276 |
| 2017 | $3,034 | $6,285 | $3,009 | $3,276 |
| 2016 | $3,604 | $6,122 | $2,758 | $3,364 |
| 2015 | $3,399 | $6,122 | $2,758 | $3,364 |
| 2014 | $3,351 | $6,122 | $2,758 | $3,364 |
| 2013 | $4,004 | $7,369 | $2,758 | $4,611 |
Source: Public Records
Map
Nearby Homes
- 226 S Orchard Dr
- 71 Cherry St
- 123 Peach St
- 243 Indianwood Blvd
- 55 Apple Ln
- 131 Sauk Trail
- 35 Mcgarity Rd Unit 772
- 454 Victoria Cir
- 18 E Rocket Cir
- 142 Marquette St
- 43 Indianwood Blvd Unit 181
- 74 Marquette St
- 42 Sauk Trail
- 27 Apple Ct
- 28 Apple Ln
- 322 Nokomis St
- 417 Lakewood Blvd
- 62 Marquette St
- 3538 Western Ave Unit 84
- 214 Marquette St
- 102 Peach St
- 204 S Orchard Dr
- 104 Peach St
- 23 Indianwood Blvd Unit 207
- 203 Indianwood Blvd
- 201 Indianwood Blvd
- 205 Indianwood Blvd
- 103 Peach St
- 106 Peach St
- 207 Indianwood Blvd
- 105 Peach St
- 209 Indianwood Blvd
- 108 Peach St
- 212 S Orchard Dr
- 107 Peach St
- 211 Indianwood Blvd
- 110 Peach St
- 214 S Orchard Dr
- 109 Peach St