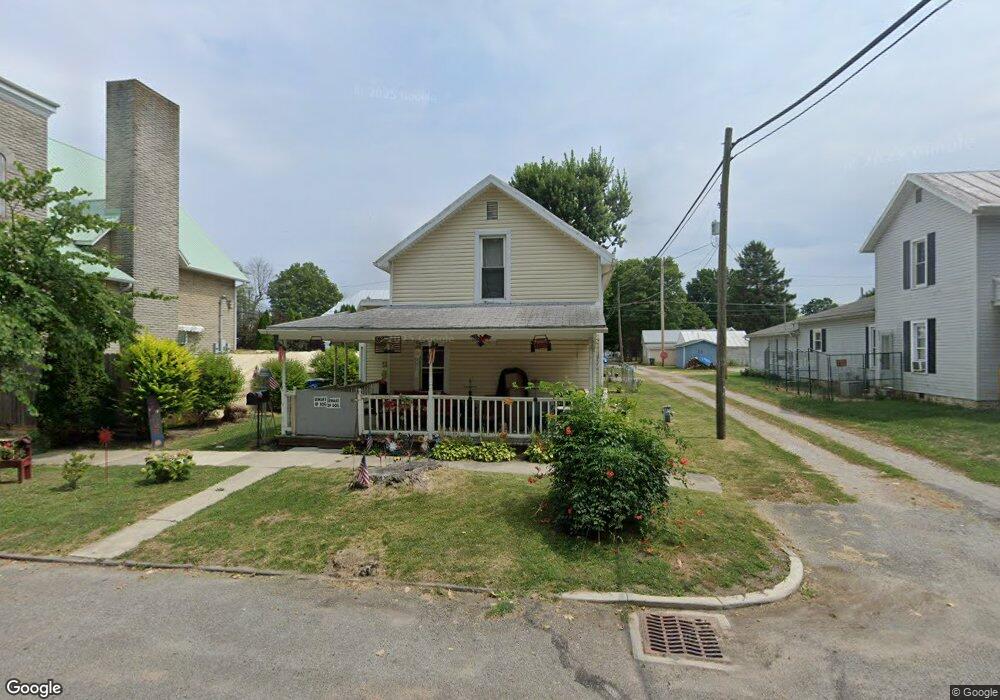
206 S Patterson St Forest, OH 45843
Estimated Value: $96,515 - $112,000
3
Beds
1
Bath
1,289
Sq Ft
$79/Sq Ft
Est. Value
About This Home
This home is located at 206 S Patterson St, Forest, OH 45843 and is currently estimated at $101,379, approximately $78 per square foot. 206 S Patterson St is a home located in Hardin County with nearby schools including Riverdale Middle School and Riverdale High School.
Ownership History
Date
Name
Owned For
Owner Type
Purchase Details
Closed on
Sep 26, 2007
Sold by
Whitaker Richard E and Whitaker Rebecca
Bought by
Stacy Mac A
Current Estimated Value
Home Financials for this Owner
Home Financials are based on the most recent Mortgage that was taken out on this home.
Original Mortgage
$53,100
Outstanding Balance
$32,838
Interest Rate
6.66%
Mortgage Type
Unknown
Estimated Equity
$68,541
Purchase Details
Closed on
Jan 25, 2007
Sold by
Fannie Mae
Bought by
Whitaker Richard E and Whitaker Rebecca
Purchase Details
Closed on
Mar 27, 2006
Sold by
Roach Cory R and Doe Jane
Bought by
Federal National Mortgage Association
Purchase Details
Closed on
Jul 8, 2003
Bought by
Roach Cory R
Purchase Details
Closed on
Mar 25, 2003
Bought by
Zigteman Norman A
Purchase Details
Closed on
Sep 11, 2000
Bought by
Roach Ray and Roach Murna B
Purchase Details
Closed on
Feb 14, 2000
Bought by
Roach Ray
Create a Home Valuation Report for This Property
The Home Valuation Report is an in-depth analysis detailing your home's value as well as a comparison with similar homes in the area
Purchase History
| Date | Buyer | Sale Price | Title Company |
|---|---|---|---|
| Stacy Mac A | -- | None Available | |
| Whitaker Richard E | $16,500 | None Available | |
| Federal National Mortgage Association | $40,000 | None Available | |
| Roach Cory R | $52,500 | -- | |
| Zigteman Norman A | $10,000 | -- | |
| Roach Ray | $13,900 | -- | |
| Roach Ray | -- | -- |
Source: Public Records
Mortgage History
| Date | Status | Borrower | Loan Amount |
|---|---|---|---|
| Open | Stacy Mac A | $53,100 |
Source: Public Records
Tax History
| Year | Tax Paid | Tax Assessment Tax Assessment Total Assessment is a certain percentage of the fair market value that is determined by local assessors to be the total taxable value of land and additions on the property. | Land | Improvement |
|---|---|---|---|---|
| 2024 | $870 | $26,520 | $770 | $25,750 |
| 2023 | $871 | $26,520 | $770 | $25,750 |
| 2022 | $767 | $20,420 | $710 | $19,710 |
| 2021 | $831 | $20,420 | $710 | $19,710 |
| 2020 | $833 | $20,420 | $710 | $19,710 |
| 2019 | $636 | $15,810 | $670 | $15,140 |
| 2018 | $609 | $15,810 | $670 | $15,140 |
| 2017 | $608 | $15,810 | $670 | $15,140 |
| 2016 | $448 | $11,380 | $800 | $10,580 |
| 2015 | $403 | $11,380 | $800 | $10,580 |
| 2014 | $421 | $11,380 | $800 | $10,580 |
| 2013 | $414 | $11,380 | $800 | $10,580 |
Source: Public Records
Map
Nearby Homes
- 412 S Patterson St
- 0 S Patterson St
- 0 S Davis St
- 402 E Lima St
- 511 S Davis St
- 406 Wells Rd
- 18660 County Road 20
- 0 Cr 215 Unit 11594771
- 0 Cr 215 Unit 11594600
- 0 Cr 215 Unit 25370311
- 0 Cr 215 Unit 11598074
- 3065 County Road 205
- 11270 Township Road 79
- 15047 Ohio 37
- 19507 County Highway 70
- 21426 County Road 17
- 15090 County Road 304
- 162 N Main St
- 213 Sandusky St W
- 5091 County Road 175
- 208 S Patterson St
- 205 S Patterson St
- 101 E Dixon St
- 210 S Patterson St
- 207 S Patterson St
- 211 S Patterson St
- 212 S Patterson St
- 105 W Dixon St
- 109 E Dixon St
- 111 S Patterson St
- 106 E Dixon St
- 110 S Patterson St
- 110 S Patterson St
- 207 S Gormley St
- 108 E Dixon St
- 109 S Patterson St
- 109 W Dixon St
- 211 S Gormley St
- 110 E Dixon St
Your Personal Tour Guide
Ask me questions while you tour the home.