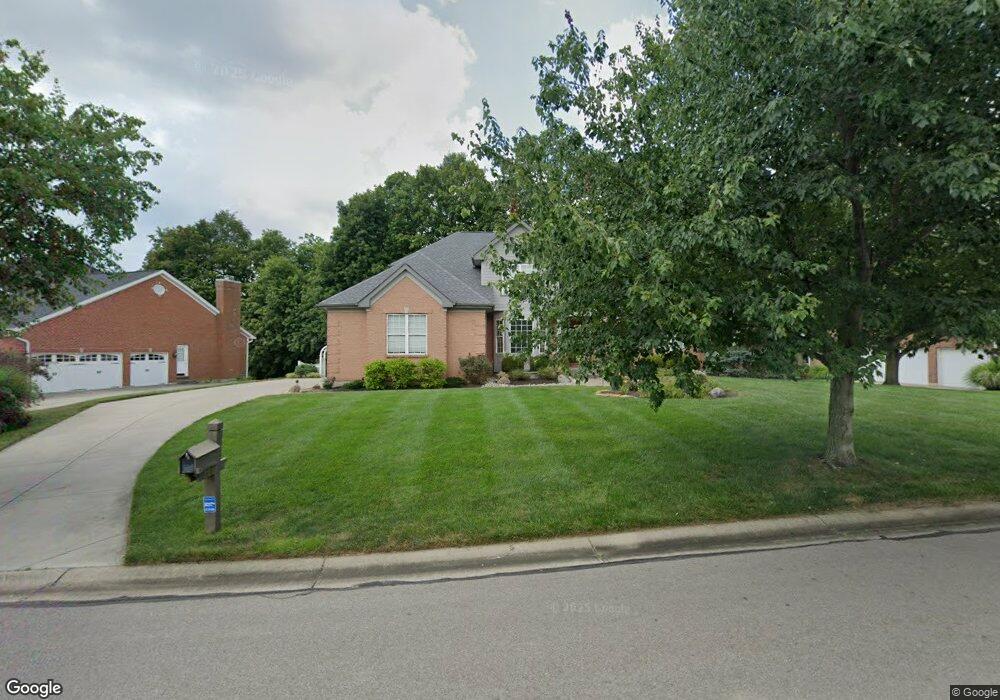
206 Sentry Hill Dr Loveland, OH 45140
Estimated Value: $584,259 - $743,000
4
Beds
4
Baths
2,444
Sq Ft
$272/Sq Ft
Est. Value
About This Home
This home is located at 206 Sentry Hill Dr, Loveland, OH 45140 and is currently estimated at $665,815, approximately $272 per square foot. 206 Sentry Hill Dr is a home located in Warren County with nearby schools including Loveland Primary School, Loveland Elementary School, and Loveland Intermediate School.
Ownership History
Date
Name
Owned For
Owner Type
Purchase Details
Closed on
Nov 15, 2011
Sold by
Fischer John R and Fischer Donna M
Bought by
Hamilton Megan E and Hamilton Jason D
Current Estimated Value
Home Financials for this Owner
Home Financials are based on the most recent Mortgage that was taken out on this home.
Original Mortgage
$295,450
Outstanding Balance
$202,051
Interest Rate
4.08%
Mortgage Type
Purchase Money Mortgage
Estimated Equity
$463,764
Purchase Details
Closed on
Aug 6, 2001
Sold by
Brown Michael
Bought by
Fischer John R and Fischer Donna
Home Financials for this Owner
Home Financials are based on the most recent Mortgage that was taken out on this home.
Original Mortgage
$150,000
Interest Rate
7.14%
Mortgage Type
New Conventional
Purchase Details
Closed on
May 20, 1999
Sold by
M/I Schottenstein Homes
Bought by
Brown Michael R and Brown Kristie R
Create a Home Valuation Report for This Property
The Home Valuation Report is an in-depth analysis detailing your home's value as well as a comparison with similar homes in the area
Home Values in the Area
Average Home Value in this Area
Purchase History
| Date | Buyer | Sale Price | Title Company |
|---|---|---|---|
| Hamilton Megan E | $311,000 | Lawyers Title | |
| Fischer John R | $324,900 | -- | |
| Brown Michael R | $10,000 | -- |
Source: Public Records
Mortgage History
| Date | Status | Borrower | Loan Amount |
|---|---|---|---|
| Open | Hamilton Megan E | $295,450 | |
| Previous Owner | Fischer John R | $150,000 |
Source: Public Records
Tax History Compared to Growth
Tax History
| Year | Tax Paid | Tax Assessment Tax Assessment Total Assessment is a certain percentage of the fair market value that is determined by local assessors to be the total taxable value of land and additions on the property. | Land | Improvement |
|---|---|---|---|---|
| 2024 | $7,250 | $156,840 | $31,500 | $125,340 |
| 2023 | $5,918 | $123,154 | $23,310 | $99,844 |
| 2022 | $6,692 | $123,155 | $23,310 | $99,845 |
| 2021 | $6,126 | $123,155 | $23,310 | $99,845 |
| 2020 | $5,937 | $110,950 | $21,000 | $89,950 |
| 2019 | $6,273 | $110,950 | $21,000 | $89,950 |
| 2018 | $6,314 | $110,950 | $21,000 | $89,950 |
| 2017 | $6,118 | $106,103 | $20,409 | $85,694 |
| 2016 | $6,594 | $106,103 | $20,409 | $85,694 |
| 2015 | $6,597 | $106,103 | $20,409 | $85,694 |
| 2014 | $6,185 | $96,460 | $18,550 | $77,900 |
| 2013 | $5,627 | $109,180 | $21,000 | $88,180 |
Source: Public Records
Map
Nearby Homes
- 19 Chimney Ridge Dr
- Vaquero Plan at Chimney Ridge
- Lexington Plan at Chimney Ridge
- 436 E Loveland Ave
- 222 Obannon Ave
- 28 Heath Ct
- 0 Ohio 48
- 27 Heath Ct
- 0.87ac E Broadway St
- 209 W Decatur Ln
- 181 Eastbury Dr
- 446 Ohio Ave
- 102 Oak St
- 103 Timber Cove
- 10549 S St Rt 48
- 619 W Loveland Ave
- 335 Ruth St
- 621 W Loveland Ave
- 334 Robin Ave
- 800 Florence Ave
- 204 Sentry Hill Dr
- 210 Sentry Hill Dr
- 202 Sentry Hill Dr
- 205 Sentry Hill Dr
- 303 Caprice Ct
- 209 Sentry Hill Dr
- 212 Sentry Hill Dr
- 203 Sentry Hill Dr
- 214 Sentry Hill Dr
- 211 Sentry Hill Dr
- 305 Caprice Ct
- 304 Caprice Ct
- 213 Sentry Hill Dr
- 201 Sentry Hill Dr
- 307 Caprice Ct
- 101 Overlook Dr
- 306 Caprice Ct
- 215 Sentry Hill Dr
- 132 Blossom View Dr
- 132 Blossom View Dr Unit 501