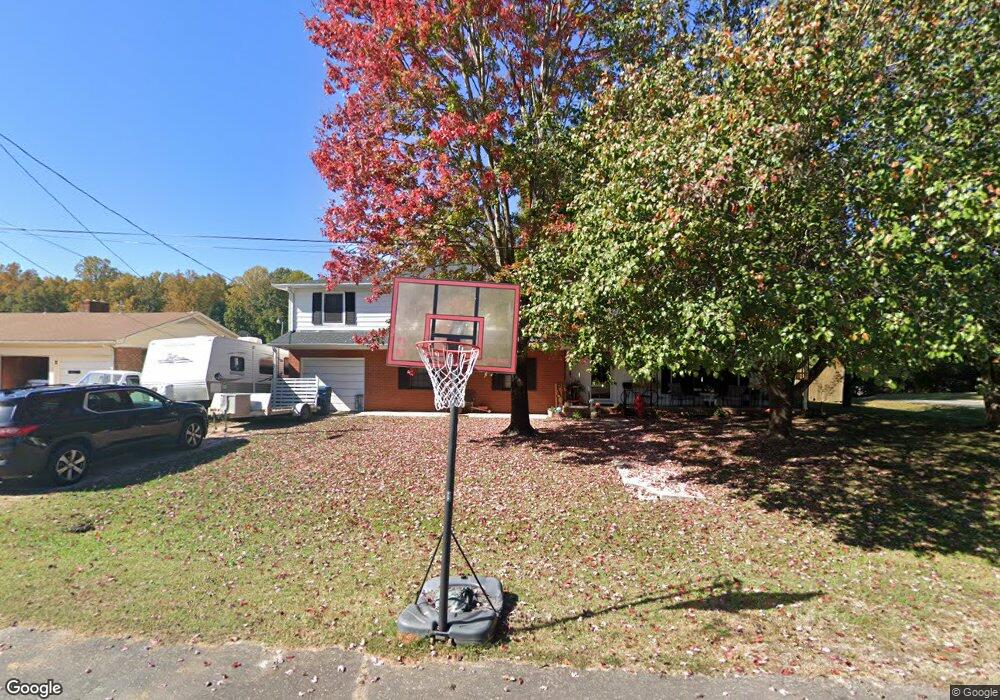
206 Skycrest Ln China Grove, NC 28023
Estimated Value: $313,000 - $362,000
5
Beds
4
Baths
2,860
Sq Ft
$120/Sq Ft
Est. Value
About This Home
This home is located at 206 Skycrest Ln, China Grove, NC 28023 and is currently estimated at $343,849, approximately $120 per square foot. 206 Skycrest Ln is a home located in Rowan County with nearby schools including Landis Elementary School, Corriher Lipe Middle School, and South Rowan High School.
Ownership History
Date
Name
Owned For
Owner Type
Purchase Details
Closed on
Jan 11, 2017
Sold by
Mk Affordable Properties Llc
Bought by
Endicott Benjamin J and Endicott Laura A
Current Estimated Value
Home Financials for this Owner
Home Financials are based on the most recent Mortgage that was taken out on this home.
Original Mortgage
$134,419
Outstanding Balance
$109,585
Interest Rate
3.75%
Mortgage Type
FHA
Estimated Equity
$234,264
Purchase Details
Closed on
Feb 28, 2011
Sold by
Koehler Michael
Bought by
Mk Affordable Properties Llc
Purchase Details
Closed on
May 14, 2010
Sold by
Reo Properties Corporation
Bought by
Koehler Michael
Purchase Details
Closed on
Apr 9, 2010
Sold by
Db Structured Products Inc
Bought by
Reo Properties Corporation
Purchase Details
Closed on
Sep 2, 2009
Sold by
Funderburk Robert and Funderburk Patricia L
Bought by
Db Structured Products Inc
Create a Home Valuation Report for This Property
The Home Valuation Report is an in-depth analysis detailing your home's value as well as a comparison with similar homes in the area
Home Values in the Area
Average Home Value in this Area
Purchase History
| Date | Buyer | Sale Price | Title Company |
|---|---|---|---|
| Endicott Benjamin J | $137,000 | None Available | |
| Mk Affordable Properties Llc | -- | None Available | |
| Koehler Michael | $65,500 | None Available | |
| Reo Properties Corporation | -- | None Available | |
| Db Structured Products Inc | $127,500 | None Available |
Source: Public Records
Mortgage History
| Date | Status | Borrower | Loan Amount |
|---|---|---|---|
| Open | Endicott Benjamin J | $134,419 |
Source: Public Records
Tax History Compared to Growth
Tax History
| Year | Tax Paid | Tax Assessment Tax Assessment Total Assessment is a certain percentage of the fair market value that is determined by local assessors to be the total taxable value of land and additions on the property. | Land | Improvement |
|---|---|---|---|---|
| 2025 | $1,536 | $246,716 | $18,180 | $228,536 |
| 2024 | $1,536 | $246,716 | $18,180 | $228,536 |
| 2023 | $1,536 | $246,716 | $18,180 | $228,536 |
| 2022 | $1,023 | $146,186 | $15,150 | $131,036 |
| 2021 | $1,023 | $146,186 | $15,150 | $131,036 |
| 2020 | $1,023 | $146,186 | $15,150 | $131,036 |
| 2019 | $1,023 | $146,186 | $15,150 | $131,036 |
| 2018 | $874 | $125,868 | $15,150 | $110,718 |
| 2017 | $874 | $125,868 | $15,150 | $110,718 |
| 2016 | $874 | $125,868 | $15,150 | $110,718 |
| 2015 | $887 | $125,868 | $15,150 | $110,718 |
| 2014 | $908 | $131,183 | $15,150 | $116,033 |
Source: Public Records
Map
Nearby Homes
- 514 W Blume St
- 185 Homer Corriher Rd
- 321 N Kimmons St
- 145 Darlington Dr
- 2785 Nc 152 W
- 407 W Mill St
- 413 W Ridge Ave
- 0 W Ridge Ave
- 440 Mt Moriah Church Rd
- 2135 Nc 152 W
- 616 S Main St
- 575 Brown Rd
- 604 S Zion St
- 208 S Chapel St
- 0 N Chapel St
- 233 E Rice St Unit 9
- 321 E Taylor St
- 0 E Taylor St
- 411 S Central Ave
- 0 Phillips St
- 204 Skycrest Ln
- 1460 Flat Rock Rd
- 127 Rollingwood Ave
- 207 Skycrest Ln
- 143 Rollingwood Ave
- 202 Skycrest Ln
- 165 Rollingwood Ave
- 1440 Flat Rock Rd
- 1520 Flat Rock Rd
- 205 Skycrest Ave
- 200 Skycrest Ln
- 189 Rollingwood Ave
- 1420 Flat Rock Rd
- 201 Skycrest Ln
- 175 Greenbriar Dr
- 1370 Flat Rock Rd
- 185 Greenbriar Dr
- 1350 Flat Rock Rd
- 1525 Flat Rock Rd
- 001 Flat Rock Rd