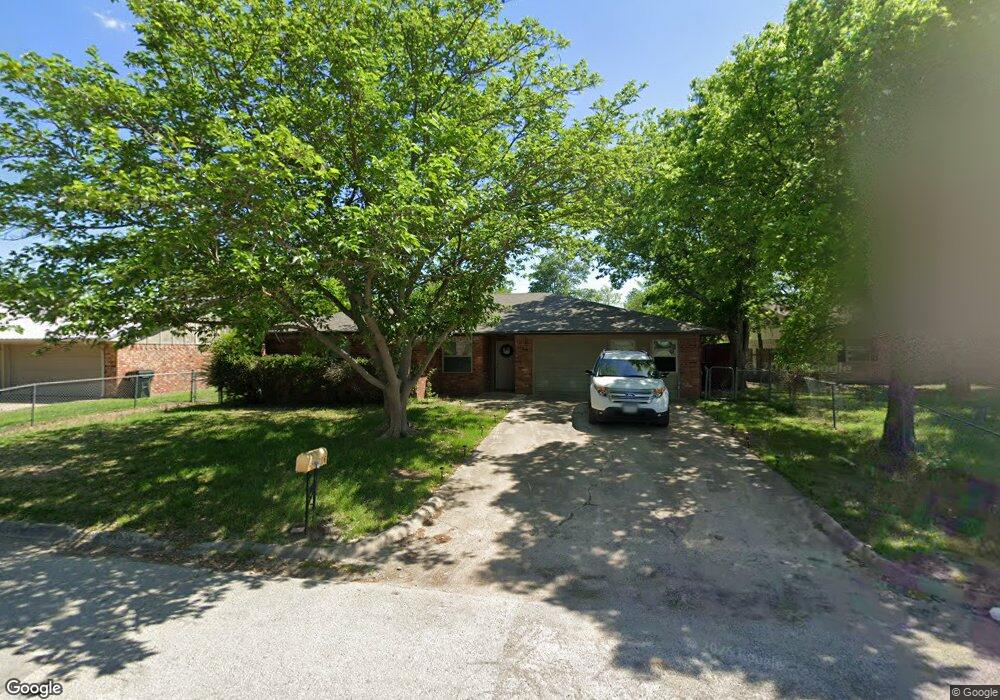
206 Southland Dr Sanger, TX 76266
Estimated Value: $272,000 - $302,000
4
Beds
3
Baths
1,654
Sq Ft
$173/Sq Ft
Est. Value
About This Home
This home is located at 206 Southland Dr, Sanger, TX 76266 and is currently estimated at $286,404, approximately $173 per square foot. 206 Southland Dr is a home located in Denton County with nearby schools including Chisholm Trail Elementary School, Clear Creek Intermediate School, and Sanger Sixth Grade Campus.
Ownership History
Date
Name
Owned For
Owner Type
Purchase Details
Closed on
May 23, 2022
Sold by
Heard Virgil Gale
Bought by
Westoplex Renewal Co Llc
Current Estimated Value
Purchase Details
Closed on
Aug 16, 2011
Sold by
Secretary Of Housing & Urban Development
Bought by
Heard Alston B
Purchase Details
Closed on
Jan 12, 2011
Sold by
Citimortgage Inc
Bought by
The Secretary Of Housing & Urban Develop
Purchase Details
Closed on
Jan 4, 2011
Sold by
Escobedo Felipe and Escobedo Jona
Bought by
Citimortgage Inc
Purchase Details
Closed on
Apr 29, 1997
Sold by
Rosenberg Charles Michael and Engel Dorothy Ann
Bought by
Escobedo Felipe and Escobedo Jona
Purchase Details
Closed on
Aug 15, 1996
Sold by
Bell Joe L and Bell Joann
Bought by
Rosenberg Mike and Rosenberg Dot
Home Financials for this Owner
Home Financials are based on the most recent Mortgage that was taken out on this home.
Original Mortgage
$14,500
Interest Rate
8.42%
Create a Home Valuation Report for This Property
The Home Valuation Report is an in-depth analysis detailing your home's value as well as a comparison with similar homes in the area
Home Values in the Area
Average Home Value in this Area
Purchase History
| Date | Buyer | Sale Price | Title Company |
|---|---|---|---|
| Westoplex Renewal Co Llc | -- | None Listed On Document | |
| Heard Alston B | -- | None Available | |
| The Secretary Of Housing & Urban Develop | -- | None Available | |
| Citimortgage Inc | $93,401 | None Available | |
| Escobedo Felipe | -- | -- | |
| Rosenberg Mike | -- | -- |
Source: Public Records
Mortgage History
| Date | Status | Borrower | Loan Amount |
|---|---|---|---|
| Previous Owner | Rosenberg Mike | $14,500 | |
| Closed | Escobedo Felipe | $0 |
Source: Public Records
Tax History Compared to Growth
Tax History
| Year | Tax Paid | Tax Assessment Tax Assessment Total Assessment is a certain percentage of the fair market value that is determined by local assessors to be the total taxable value of land and additions on the property. | Land | Improvement |
|---|---|---|---|---|
| 2025 | $4,507 | $205,432 | $73,508 | $131,924 |
| 2024 | $4,507 | $223,000 | $73,508 | $149,492 |
| 2023 | $4,540 | $224,000 | $52,875 | $171,125 |
| 2022 | $5,034 | $226,984 | $55,131 | $171,853 |
| 2021 | $4,031 | $191,771 | $35,376 | $156,395 |
| 2020 | $4,026 | $181,961 | $35,376 | $146,585 |
| 2019 | $4,074 | $178,947 | $35,376 | $143,571 |
| 2018 | $3,398 | $148,434 | $25,268 | $123,166 |
| 2017 | $3,661 | $159,180 | $25,268 | $133,912 |
| 2016 | $2,997 | $130,299 | $14,702 | $115,597 |
| 2015 | $1,932 | $101,187 | $14,702 | $95,193 |
| 2014 | $1,932 | $91,988 | $19,301 | $72,687 |
| 2013 | -- | $87,958 | $19,301 | $68,657 |
Source: Public Records
Map
Nearby Homes
- 202 Southland Dr
- 209 Southland Dr
- 130 Southside Dr
- 226 Hillcrest St
- 2000 S Stemmons St
- 2004 S Stemmons St
- 212 Diane Dr
- 321 Quail Crossing Dr
- 319 Quail Crossing Dr
- 113 Diane Dr
- 124 Morning Glory
- 109 Colonial Heights
- 141 Shady Grove Dr
- 114 Pintail Ln
- 505 Houston St
- 117 Teal Rd
- 108 Magnolia Dr
- 144 Prairie Dr
- 185 Aster Dr
- 319 Austin St
- 204 Southland Dr
- 208 Southland Dr
- 105 Southmanor Ct
- 103 Southmanor Ct
- 107 Southmanor Ct
- 210 Southland Dr
- 205 Southland Dr
- 203 Southland Dr
- 101 Southmanor Ct
- 207 Southland Dr
- 109 Southmanor Ct
- 201 Southland Dr
- 104 Southmeadow Dr
- 111 Southmanor Ct
- 111 Southland Dr Unit A
- 110 Southland Dr
- 106 Southmeadow Dr
- 104 S Manor Ct
- 104 Southmanor Ct
- 106 Southmanor Ct