
Landlord's Agent in 2022
Kasia Skolasa
RE/MAX
(781) 521-4853
5 Total Sales
Estimated Value: $639,308 - $808,000
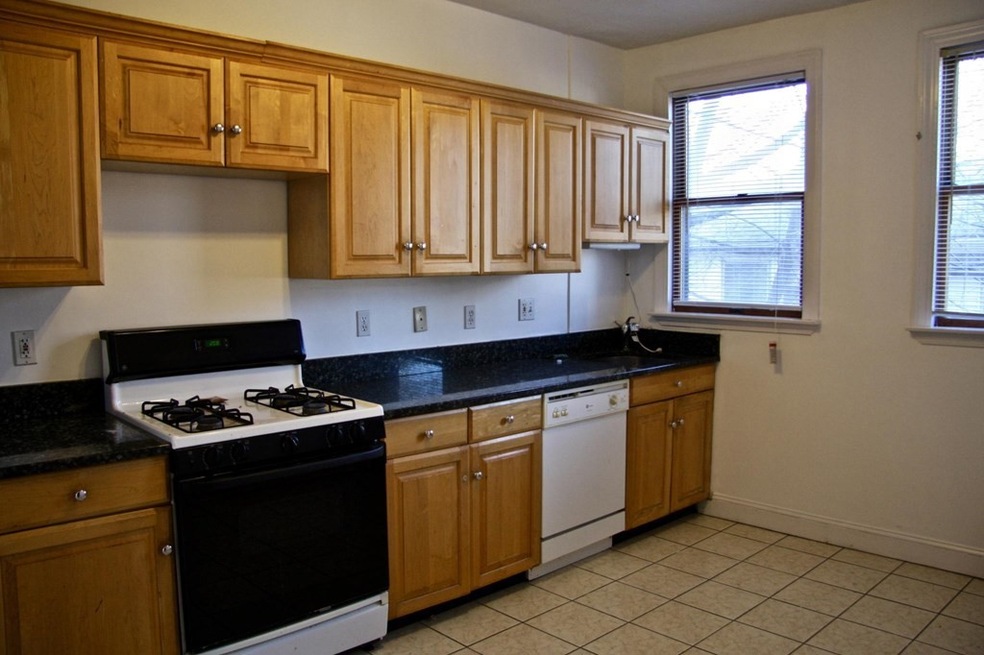
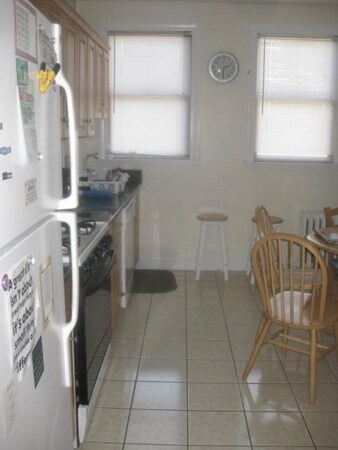
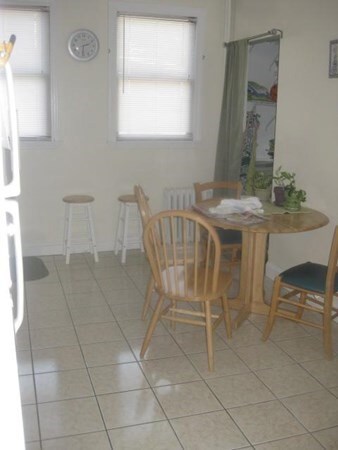
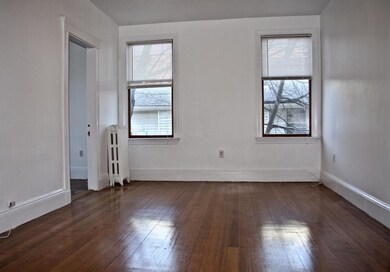
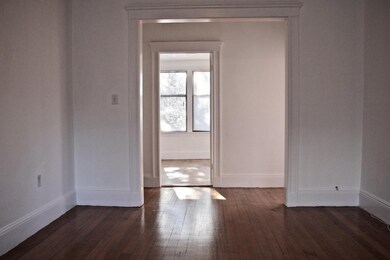
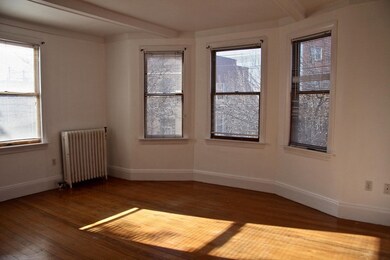
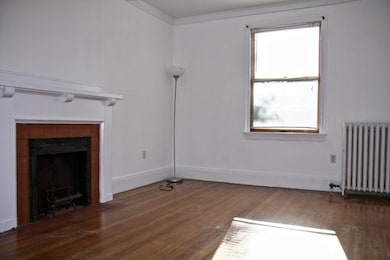
NEWTON CENTRE LOCATION !!! This sunny unit features a generous and versatile 1008 sqft layout which can be used as a 3BR or 2BR with a dining room. Features hardwood floors throughout and windows on three sides that brighten the space. The building is very charming and unique. Large eat-in kitchen with a pantry. This unit also offers a decorative fireplace and laundry in the unit. You can enjoy the restaurants and shops within walking distance. BC is close by.***video available upon request
Co-Listed By
Amanda O'grady
RE/MAX On the Charles
| Date | Buyer | Sale Price | Title Company |
|---|---|---|---|
| Li Ft | $450,000 | -- | |
| Whalen Stephen M | $280,000 | -- |
| Date | Status | Borrower | Loan Amount |
|---|---|---|---|
| Previous Owner | Whalen Stephen M | $210,000 |
| Date | Event | Price | List to Sale | Price per Sq Ft | Prior Sale |
|---|---|---|---|---|---|
| 10/24/2024 10/24/24 | Off Market | $2,800 | -- | -- | |
| 09/21/2024 09/21/24 | For Rent | $2,800 | +7.7% | -- | |
| 09/01/2022 09/01/22 | Rented | $2,600 | 0.0% | -- | |
| 08/19/2022 08/19/22 | Under Contract | -- | -- | -- | |
| 07/04/2022 07/04/22 | For Rent | $2,600 | +6.1% | -- | |
| 07/12/2021 07/12/21 | Rented | $2,450 | -3.9% | -- | |
| 07/05/2021 07/05/21 | Price Changed | $2,550 | -3.8% | $3 / Sq Ft | |
| 06/25/2021 06/25/21 | Price Changed | $2,650 | -1.9% | $3 / Sq Ft | |
| 06/10/2021 06/10/21 | For Rent | $2,700 | +5.9% | -- | |
| 05/01/2019 05/01/19 | Rented | $2,550 | 0.0% | -- | |
| 04/01/2019 04/01/19 | Under Contract | -- | -- | -- | |
| 01/08/2019 01/08/19 | For Rent | $2,550 | -10.5% | -- | |
| 08/07/2018 08/07/18 | Rented | $2,850 | 0.0% | -- | |
| 07/25/2018 07/25/18 | For Rent | $2,850 | 0.0% | -- | |
| 10/23/2015 10/23/15 | Sold | $450,000 | -4.1% | $446 / Sq Ft | View Prior Sale |
| 09/10/2015 09/10/15 | Pending | -- | -- | -- | |
| 08/26/2015 08/26/15 | Price Changed | $469,000 | -6.0% | $465 / Sq Ft | |
| 08/17/2015 08/17/15 | For Sale | $499,000 | 0.0% | $495 / Sq Ft | |
| 04/14/2015 04/14/15 | Rented | $2,450 | 0.0% | -- | |
| 03/15/2015 03/15/15 | Under Contract | -- | -- | -- | |
| 02/20/2015 02/20/15 | For Rent | $2,450 | -- | -- |
| Year | Tax Paid | Tax Assessment Tax Assessment Total Assessment is a certain percentage of the fair market value that is determined by local assessors to be the total taxable value of land and additions on the property. | Land | Improvement |
|---|---|---|---|---|
| 2025 | $5,380 | $549,000 | $0 | $549,000 |
| 2024 | $5,202 | $533,000 | $0 | $533,000 |
| 2023 | $5,241 | $514,800 | $0 | $514,800 |
| 2022 | $5,158 | $490,300 | $0 | $490,300 |
| 2021 | $4,977 | $462,500 | $0 | $462,500 |
| 2020 | $4,829 | $462,500 | $0 | $462,500 |
| 2019 | $4,692 | $449,000 | $0 | $449,000 |
| 2018 | $3,863 | $357,000 | $0 | $357,000 |
| 2017 | $3,745 | $336,800 | $0 | $336,800 |
| 2016 | $3,582 | $314,800 | $0 | $314,800 |
| 2015 | $3,481 | $299,800 | $0 | $299,800 |
Landlord's Agent in 2022
Kasia Skolasa
RE/MAX
(781) 521-4853
5 Total Sales
A
Landlord's Co-Listing Agent in 2022
Amanda O'grady
RE/MAX
Buyer's Agent in 2019
Immo Ferdinandt
Red Tree Real Estate
(617) 461-5646
2 Total Sales
Seller's Agent in 2018
Steven Schlom
Premier Property Solutions
(617) 201-2058
2 Total Sales
Seller's Agent in 2015
Massis Khoumjian
Coldwell Banker Realty - Waltham
(781) 888-5363
31 Total Sales
C
Seller's Agent in 2015
CRM Property Cor Rentals Department
City Realty Group
2 Total Sales
Source: MLS Property Information Network (MLS PIN)
MLS Number: 73006604
APN: NEWT-000061-000027-000003B
Disclaimer: Certain information contained herein is derived from information provided by parties other than Homes.com. All information provided is deemed reliable, but is not guaranteed to be accurate and should be independently verified.
![]() The property listing data and information, or the Images, set forth herein were provided to MLS Property Information Network, Inc. from third party sources, including sellers, lessors and public records, and were compiled by MLS Property Information Network, Inc. The property listing data and information, and the Images, are for the personal, non-commercial use of consumers having a good faith interest in purchasing or leasing listed properties of the type displayed to them and may not be used for any purpose other than to identify prospective properties which such consumers may have a good faith interest in purchasing or leasing. MLS Property Information Network, Inc. and its subscribers disclaim any and all representations and warranties as to the accuracy of the property listing data and information, or as to the accuracy of any of the Images, set forth herein.
The property listing data and information, or the Images, set forth herein were provided to MLS Property Information Network, Inc. from third party sources, including sellers, lessors and public records, and were compiled by MLS Property Information Network, Inc. The property listing data and information, and the Images, are for the personal, non-commercial use of consumers having a good faith interest in purchasing or leasing listed properties of the type displayed to them and may not be used for any purpose other than to identify prospective properties which such consumers may have a good faith interest in purchasing or leasing. MLS Property Information Network, Inc. and its subscribers disclaim any and all representations and warranties as to the accuracy of the property listing data and information, or as to the accuracy of any of the Images, set forth herein.