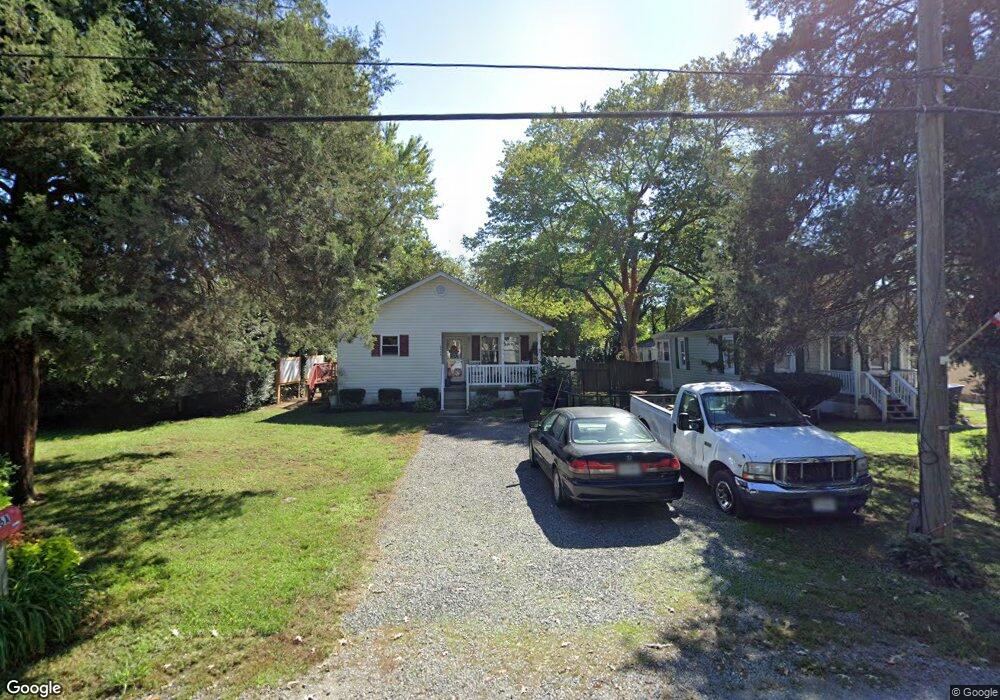
206 Third St Colonial Beach, VA 22443
Estimated Value: $192,532 - $248,000
2
Beds
1
Bath
992
Sq Ft
$231/Sq Ft
Est. Value
About This Home
This home is located at 206 Third St, Colonial Beach, VA 22443 and is currently estimated at $229,383, approximately $231 per square foot. 206 Third St is a home located in Westmoreland County with nearby schools including Colonial Beach Elementary School and Colonial Beach High School.
Ownership History
Date
Name
Owned For
Owner Type
Purchase Details
Closed on
Sep 20, 2019
Sold by
Jacobs Randal Y and Jacobs Patricia W
Bought by
Guirguis Nancy George
Current Estimated Value
Home Financials for this Owner
Home Financials are based on the most recent Mortgage that was taken out on this home.
Original Mortgage
$124,699
Outstanding Balance
$108,273
Interest Rate
3.5%
Mortgage Type
FHA
Estimated Equity
$121,110
Purchase Details
Closed on
Jun 30, 2016
Sold by
Noswander Helen K
Bought by
Jacobs Randal Y and Jacobs Patricia W
Purchase Details
Closed on
Jul 1, 2009
Sold by
Nolton Raymond W
Bought by
Niswander Jack H
Create a Home Valuation Report for This Property
The Home Valuation Report is an in-depth analysis detailing your home's value as well as a comparison with similar homes in the area
Home Values in the Area
Average Home Value in this Area
Purchase History
| Date | Buyer | Sale Price | Title Company |
|---|---|---|---|
| Guirguis Nancy George | $127,000 | Cardinal Title Group Inc | |
| Jacobs Randal Y | $50,000 | Lawyers Title | |
| Niswander Jack H | $115,445 | -- |
Source: Public Records
Mortgage History
| Date | Status | Borrower | Loan Amount |
|---|---|---|---|
| Open | Guirguis Nancy George | $124,699 |
Source: Public Records
Tax History
| Year | Tax Paid | Tax Assessment Tax Assessment Total Assessment is a certain percentage of the fair market value that is determined by local assessors to be the total taxable value of land and additions on the property. | Land | Improvement |
|---|---|---|---|---|
| 2025 | $543 | $129,400 | $39,200 | $90,200 |
| 2024 | $543 | $129,400 | $39,200 | $90,200 |
| 2023 | $518 | $129,400 | $39,200 | $90,200 |
| 2022 | $518 | $129,400 | $39,200 | $90,200 |
| 2021 | $507 | $88,700 | $39,200 | $49,500 |
| 2020 | $417 | $88,700 | $39,200 | $49,500 |
| 2018 | $355 | $88,700 | $39,200 | $49,500 |
| 2017 | -- | $88,700 | $39,200 | $49,500 |
| 2016 | $346 | $88,700 | $39,200 | $49,500 |
| 2015 | -- | $93,300 | $39,200 | $54,100 |
| 2014 | -- | $0 | $0 | $0 |
| 2013 | -- | $93,300 | $39,200 | $54,100 |
Source: Public Records
Map
Nearby Homes
Your Personal Tour Guide
Ask me questions while you tour the home.